Copyright
©The Author(s) 2020.
World J Clin Cases. Dec 6, 2020; 8(23): 5902-5917
Published online Dec 6, 2020. doi: 10.12998/wjcc.v8.i23.5902
Published online Dec 6, 2020. doi: 10.12998/wjcc.v8.i23.5902
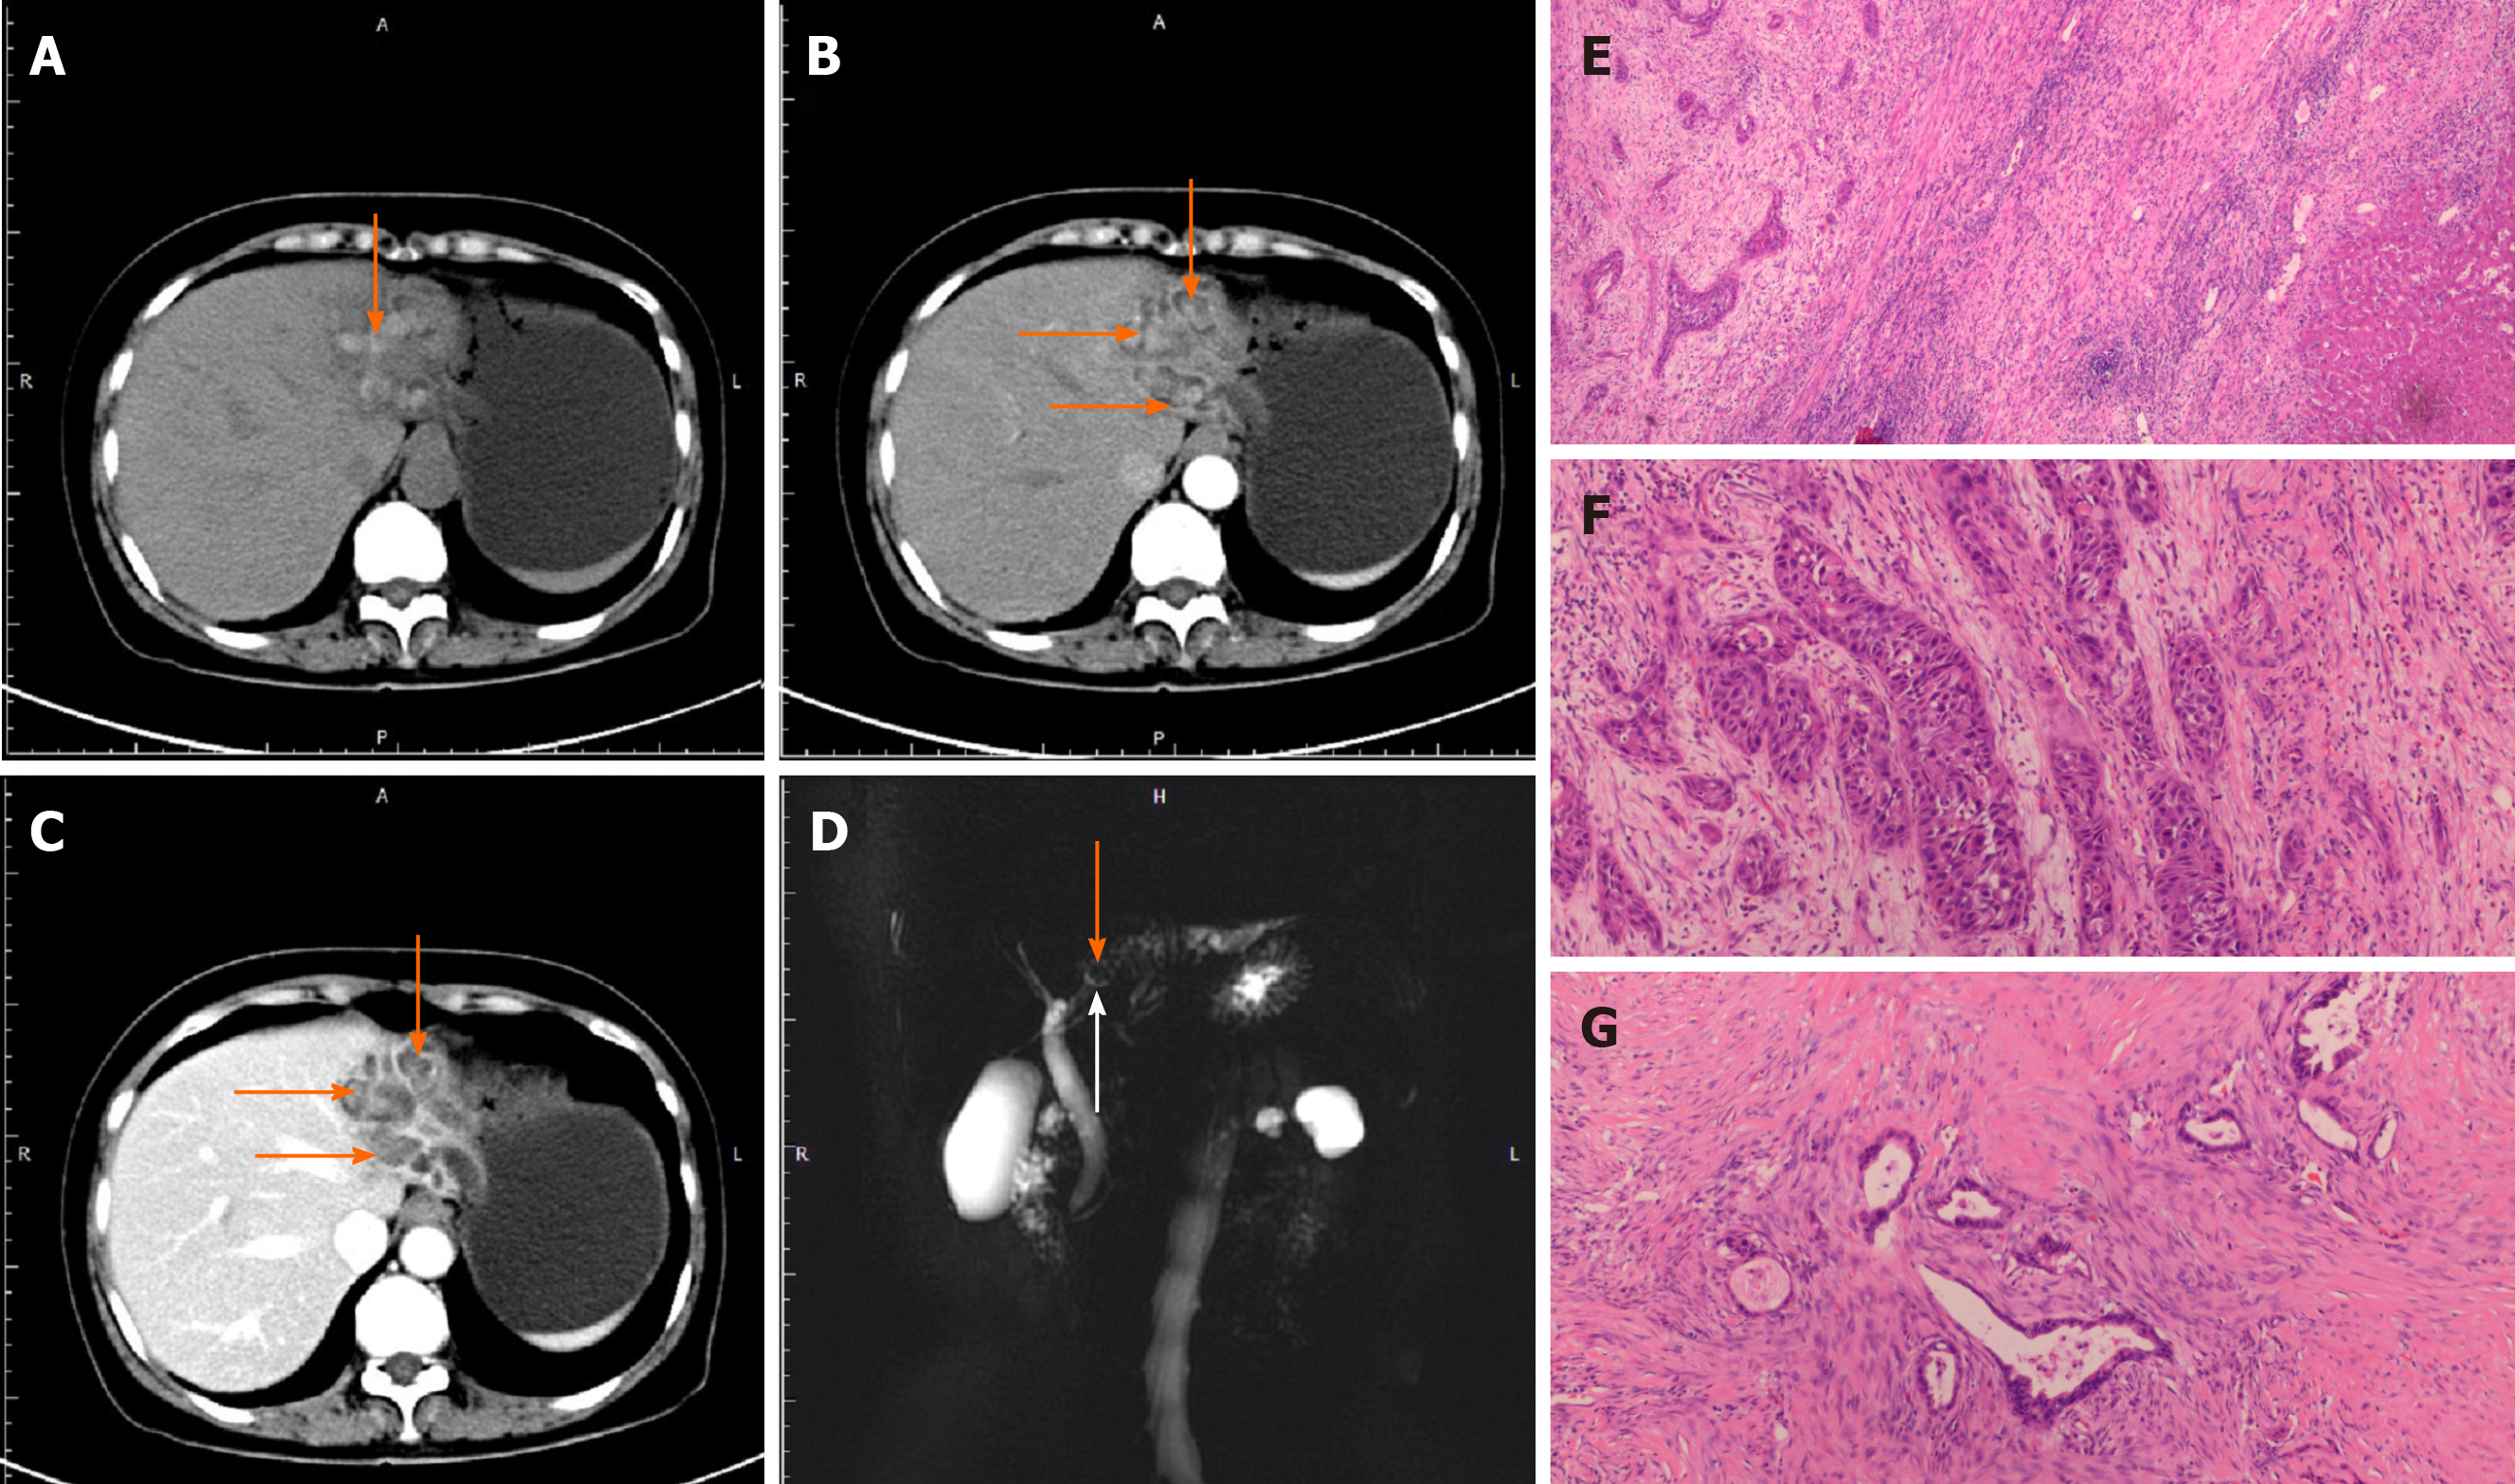
Figure 3 Computed tomography (A-C) and magnetic resonance cholangiopancreatography (D) images of patient No.
3 with adenosquamous carcinoma of the liver. A-C: The orange arrow indicates stones in the left intrahepatic bile ducts; D: The white arrow indicates that the FIHS was located at the confluence of B2/B3/B4; E-G: Pathological manifestations of adenosquamous carcinoma (ASC). Microscopically, ASC consisted of two components: adenocarcinoma (F) and squamous cell carcinoma (G).
- Citation: Zhou D, Zhang B, Zhang XY, Guan WB, Wang JD, Ma F. Focal intrahepatic strictures: A proposal classification based on diagnosis-treatment experience and systemic review. World J Clin Cases 2020; 8(23): 5902-5917
- URL: https://www.wjgnet.com/2307-8960/full/v8/i23/5902.htm
- DOI: https://dx.doi.org/10.12998/wjcc.v8.i23.5902


