Copyright
©The Author(s) 2020.
World J Clin Cases. Dec 6, 2020; 8(23): 5866-5875
Published online Dec 6, 2020. doi: 10.12998/wjcc.v8.i23.5866
Published online Dec 6, 2020. doi: 10.12998/wjcc.v8.i23.5866
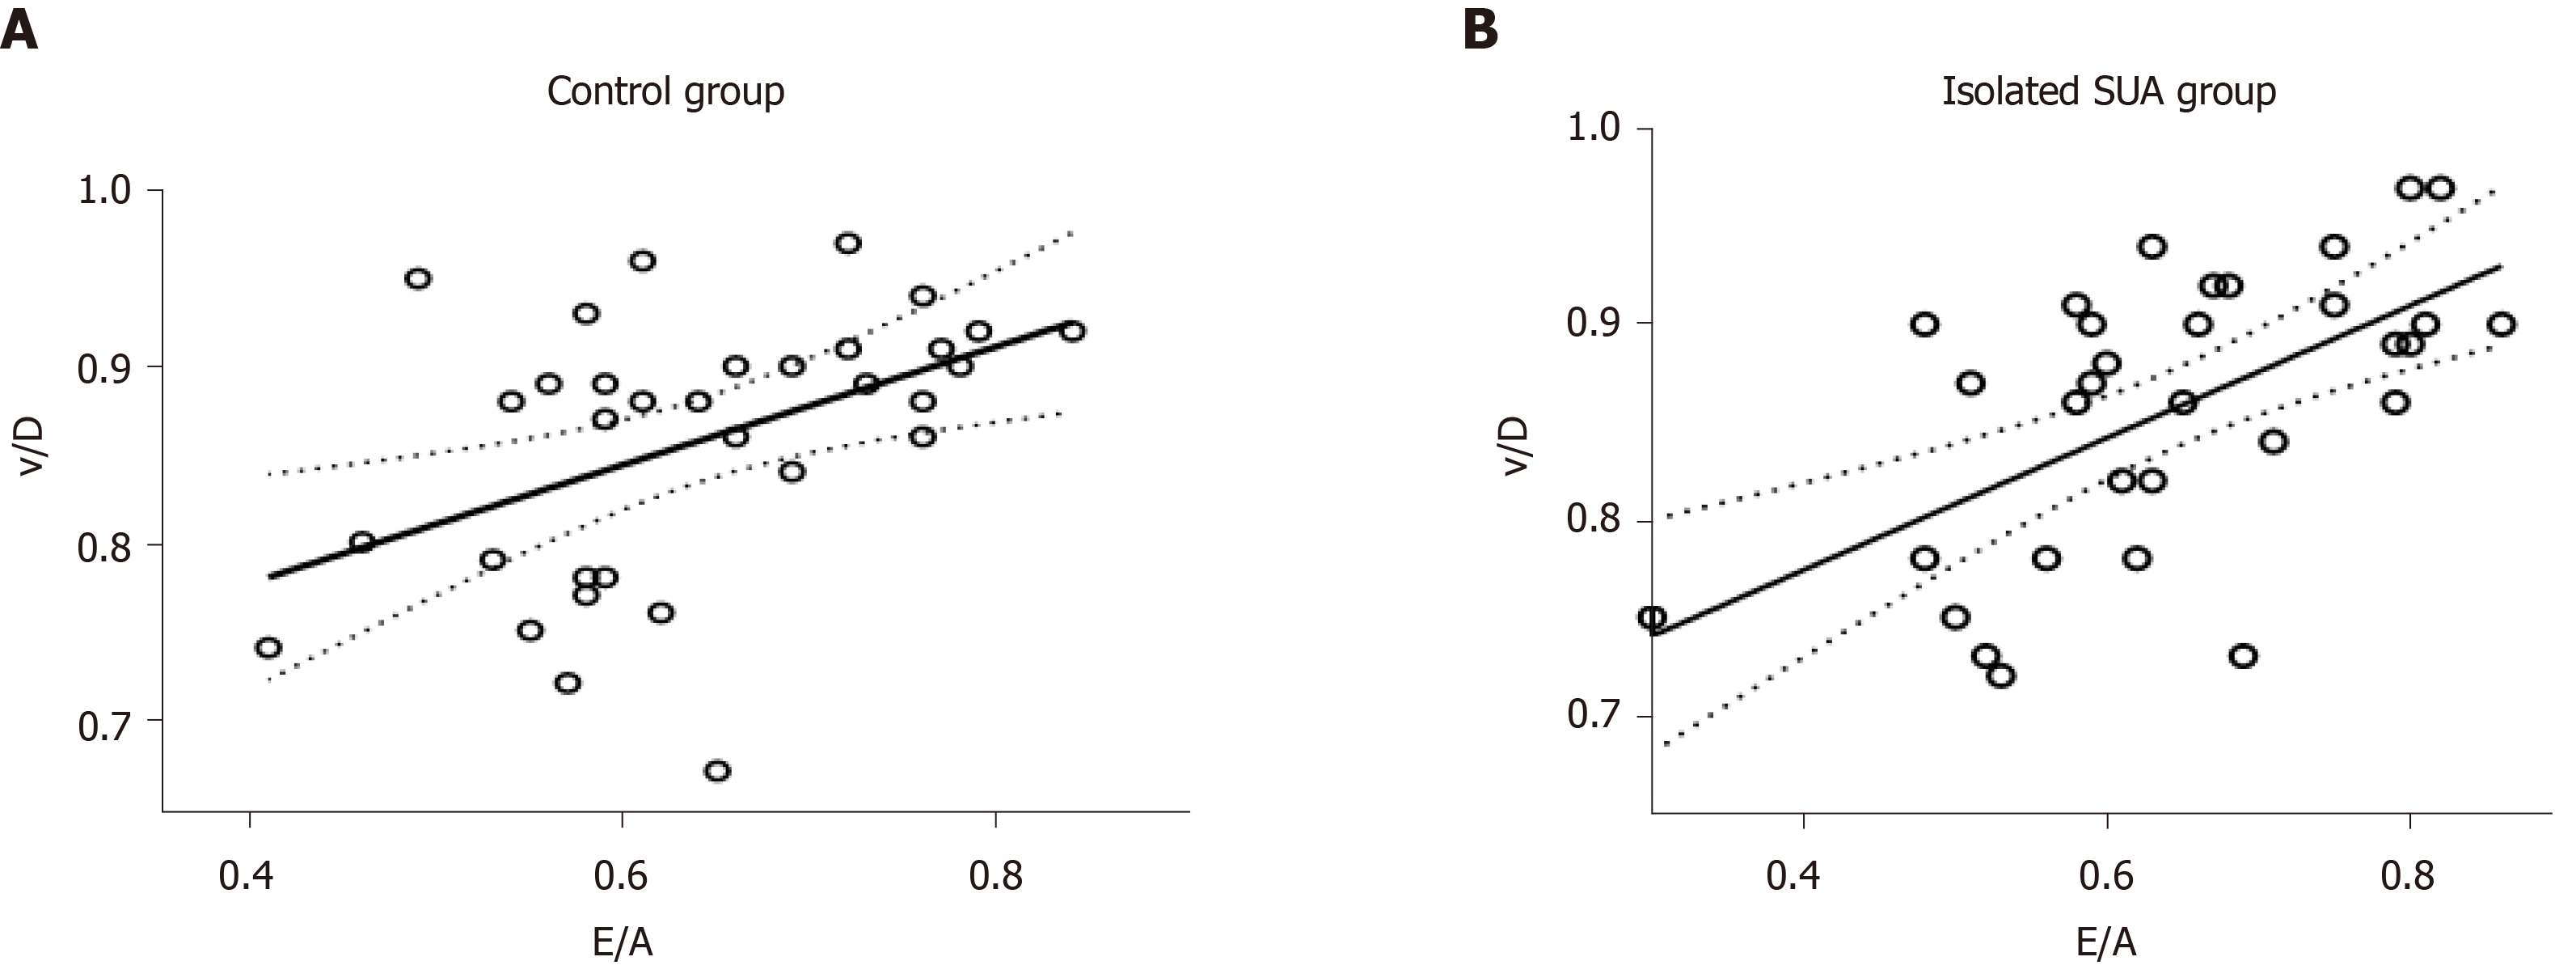
Figure 4 Scatterplots of the correlations between the ventricular late diastolic velocity/ventricular diastolic peak flow velocity and early passive/late active ratio of the isolated single umbilical artery (R2 = 0.
520) and control (R2 = 0.358). A: Control group; B: Isolated single umbilical artery (SUA) group. v/D: Ventricular late diastolic velocity/ventricular diastolic peak flow velocity; E/A: Early passive/late active.
- Citation: Li TG, Nie F, Xu XY. Correlation between ductus venosus spectrum and right ventricular diastolic function in isolated single-umbilical-artery foetus and normal foetus in third trimester. World J Clin Cases 2020; 8(23): 5866-5875
- URL: https://www.wjgnet.com/2307-8960/full/v8/i23/5866.htm
- DOI: https://dx.doi.org/10.12998/wjcc.v8.i23.5866


