Copyright
©The Author(s) 2020.
World J Clin Cases. Nov 6, 2020; 8(21): 5203-5212
Published online Nov 6, 2020. doi: 10.12998/wjcc.v8.i21.5203
Published online Nov 6, 2020. doi: 10.12998/wjcc.v8.i21.5203
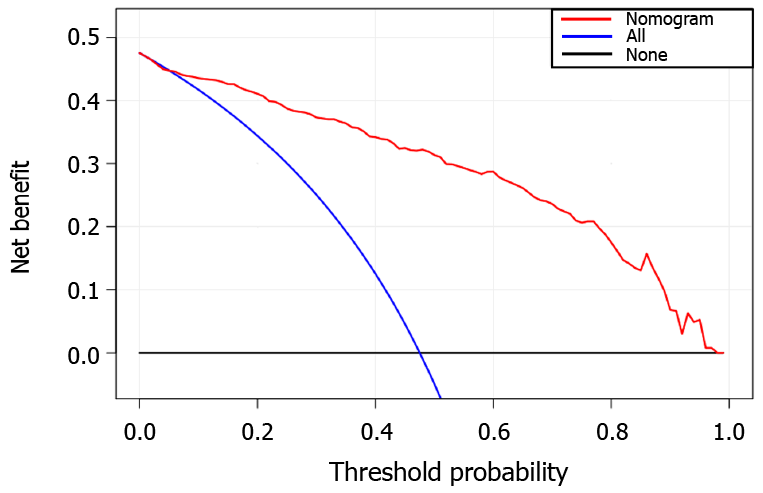
Figure 4 The decision curve analysis for the constructed radiomics nomogram model.
The X and Y axes represent the threshold probability and net benefit, respectively. The red line indicates the constructed nomogram model. The blue line represents the hypothesis that all patients had lung cancer. The black line represents the assumption that all patients had tuberculosis.
- Citation: Cui EN, Yu T, Shang SJ, Wang XY, Jin YL, Dong Y, Zhao H, Luo YH, Jiang XR. Radiomics model for distinguishing tuberculosis and lung cancer on computed tomography scans. World J Clin Cases 2020; 8(21): 5203-5212
- URL: https://www.wjgnet.com/2307-8960/full/v8/i21/5203.htm
- DOI: https://dx.doi.org/10.12998/wjcc.v8.i21.5203


