Copyright
©The Author(s) 2020.
World J Clin Cases. Oct 26, 2020; 8(20): 4966-4974
Published online Oct 26, 2020. doi: 10.12998/wjcc.v8.i20.4966
Published online Oct 26, 2020. doi: 10.12998/wjcc.v8.i20.4966
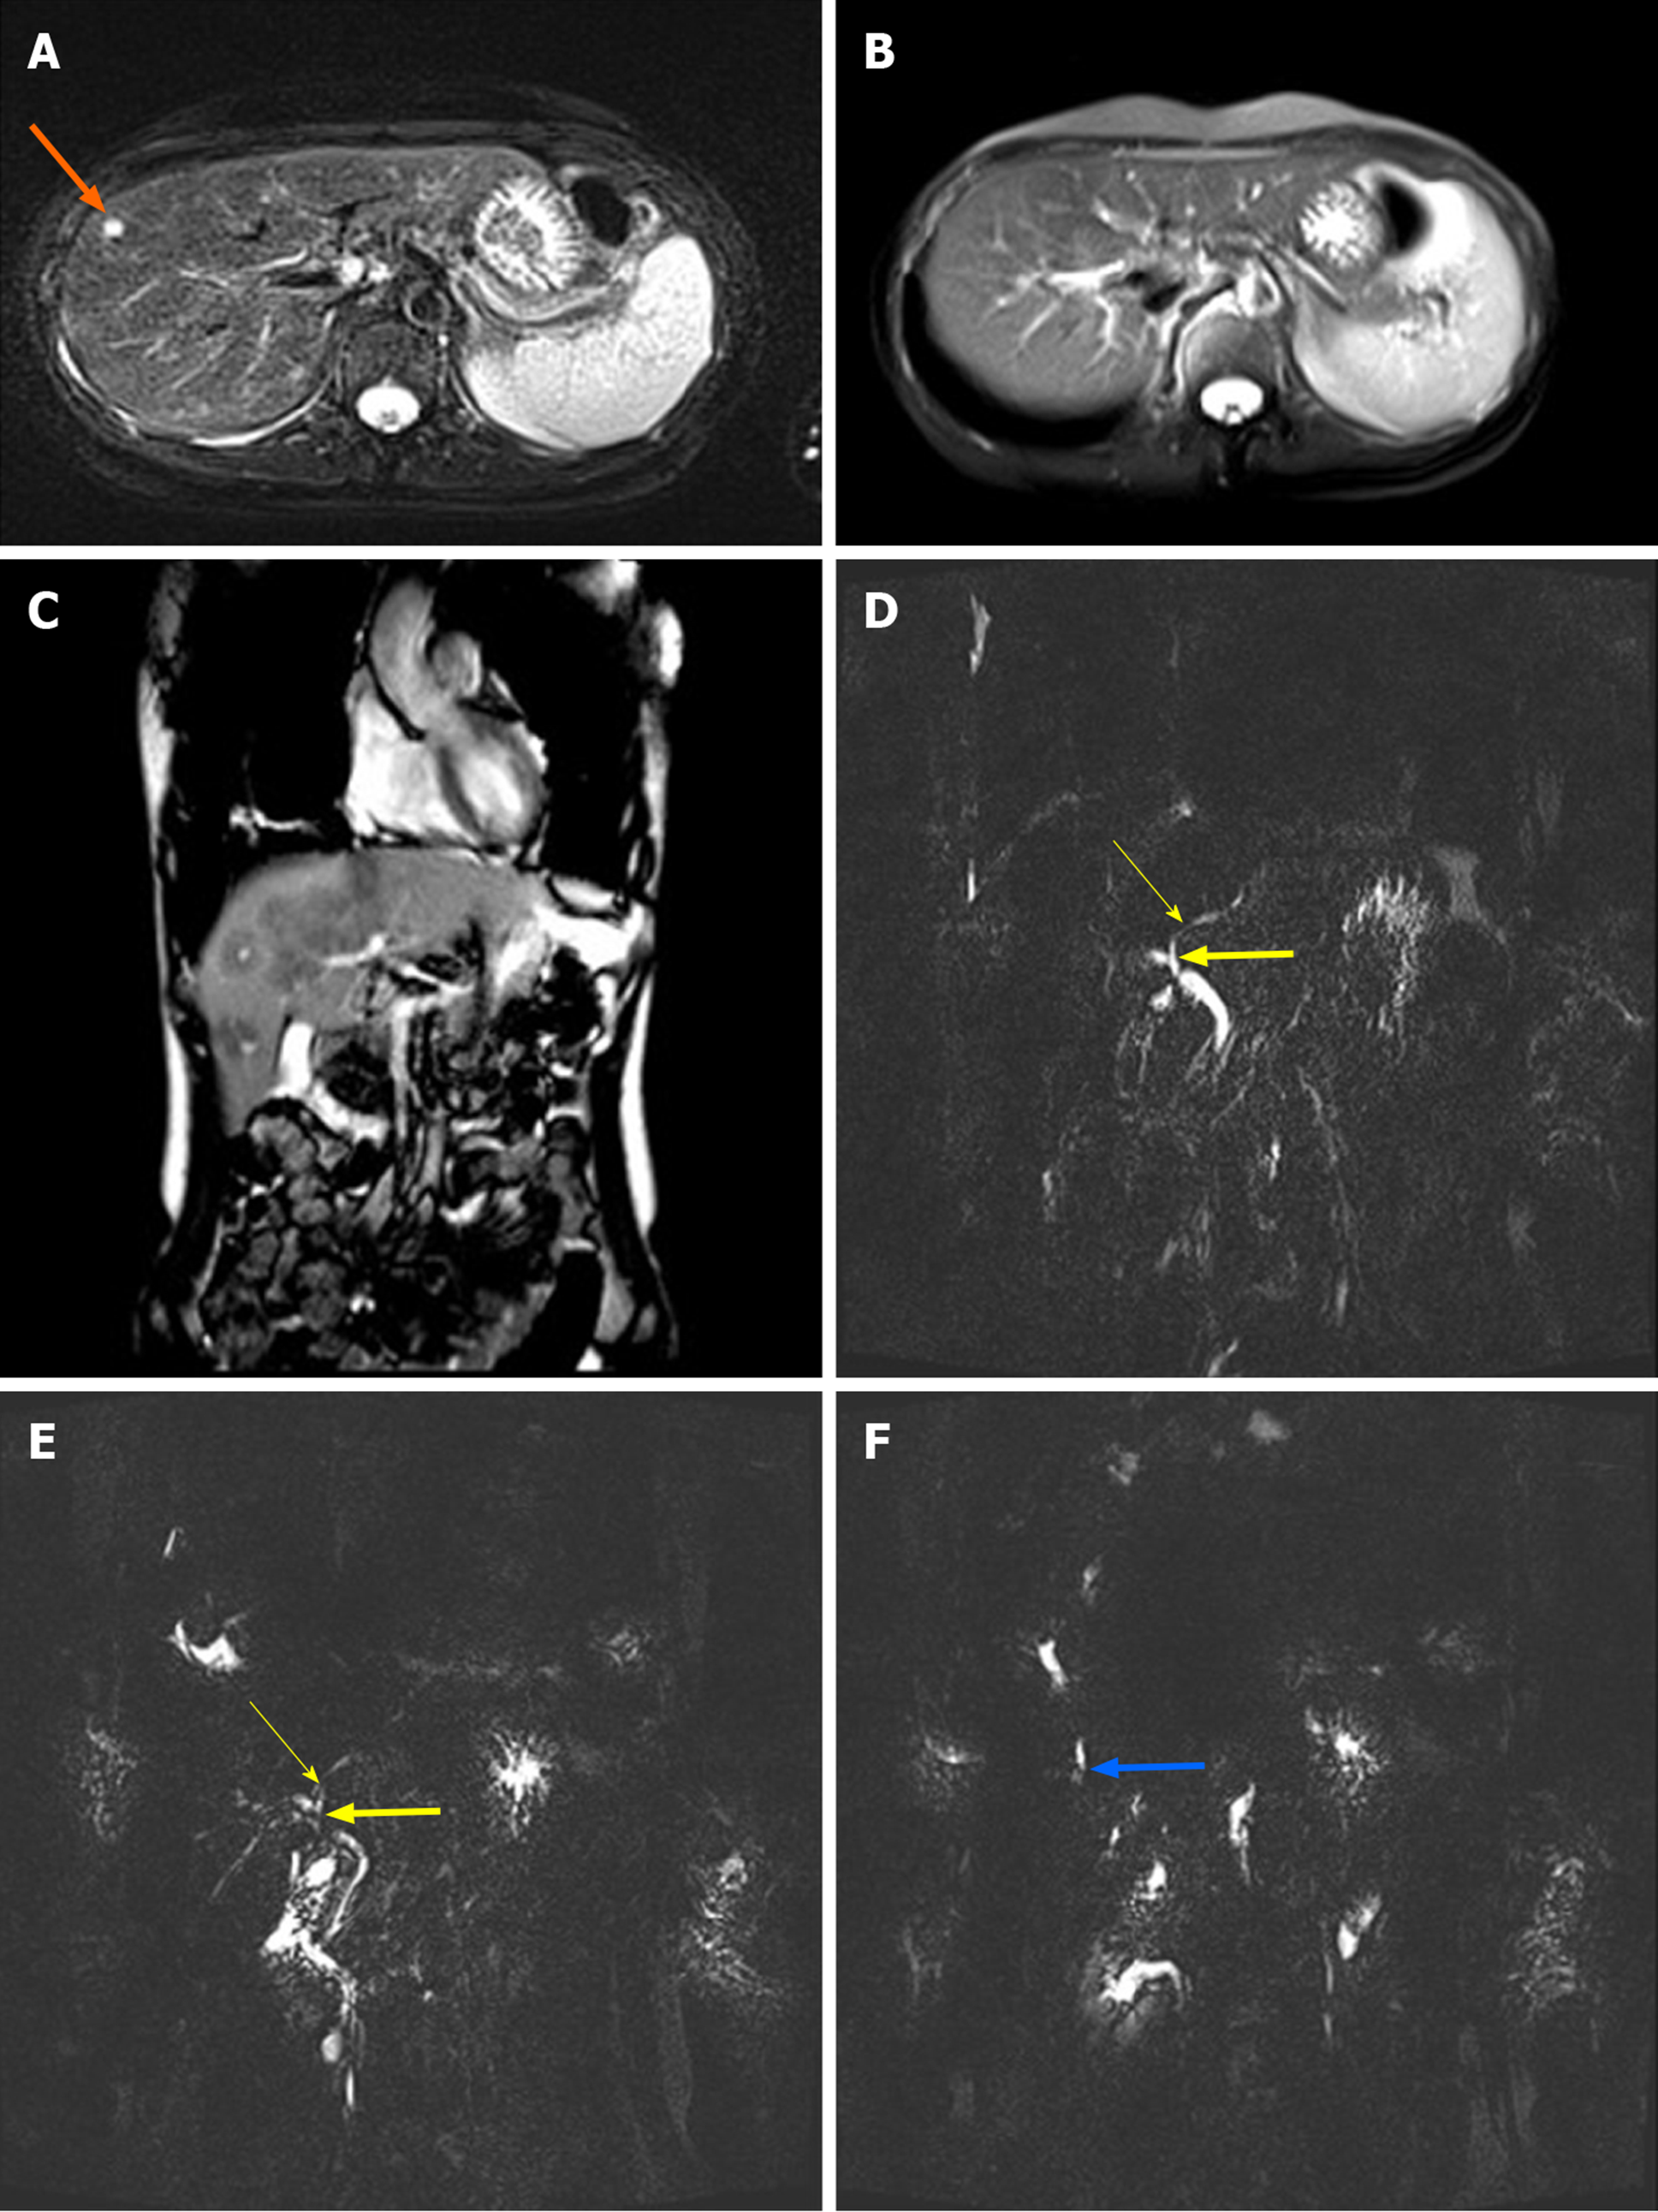
Figure 2 Liver magnetic resonance imaging and magnetic resonance cholangiopancreatography findings.
A: T2-weighted magnetic resonance imaging (MRI) images from July 2014 exhibited hyperintense nodules approximately 6 mm in size in the right lobe of the liver (orange arrow); B: T2-weighted MRI images from July 2019 revealed that the hyperintense nodules in the liver had disappeared; C: T2-weighted MRI images from July 2019 revealed the presence of hypointense lesions in the liver, predominantly distributed around the portal vein; D: Magnetic resonance cholangiopancreatography (MRCP) conducted in July 2014 revealed local stenosis in the left hepatic duct (thin yellow arrow) and the common hepatic duct (thick yellow arrow); E: MRCP conducted in July 2019 revealed that stenosis of the left hepatic duct (thin yellow arrow) and the common hepatic duct (thick yellow arrow) was aggravated; F: MRCP conducted in July 2019 revealed local dilation of the right intrahepatic bile duct (thick blue arrow).
- Citation: Wang BB, Ye JR, Li YL, Jin Y, Chen ZW, Li JM, Li YP. Multisystem involvement Langerhans cell histiocytosis in an adult: A case report. World J Clin Cases 2020; 8(20): 4966-4974
- URL: https://www.wjgnet.com/2307-8960/full/v8/i20/4966.htm
- DOI: https://dx.doi.org/10.12998/wjcc.v8.i20.4966


