Copyright
©The Author(s) 2020.
World J Clin Cases. Oct 26, 2020; 8(20): 4883-4894
Published online Oct 26, 2020. doi: 10.12998/wjcc.v8.i20.4883
Published online Oct 26, 2020. doi: 10.12998/wjcc.v8.i20.4883
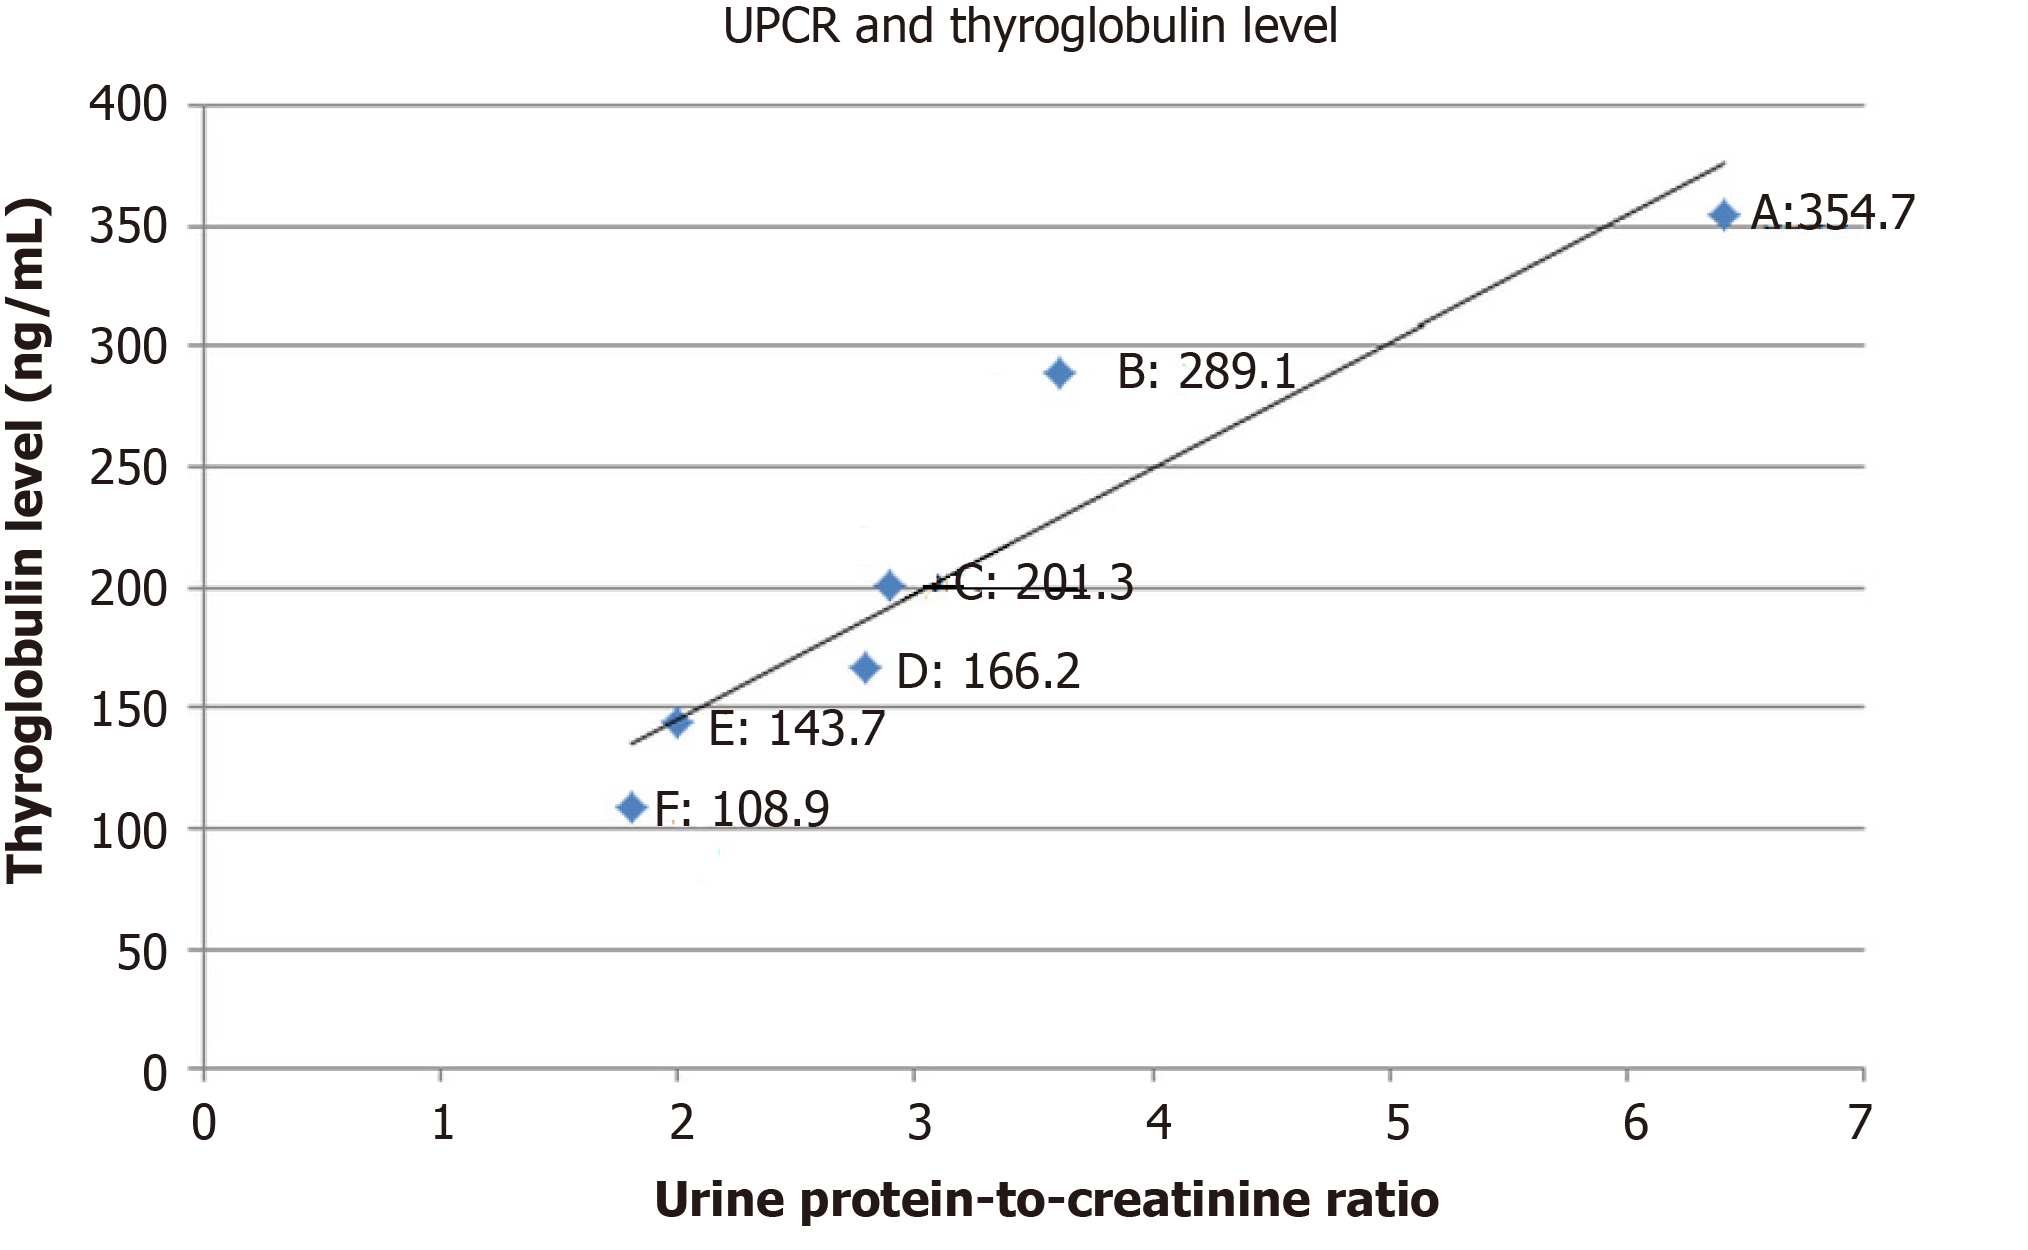
Figure 8 The serial changes of urine protein-to-creatinine ratio and thyroglobulin is pictured.
A: Lenvatinib, 10 mg/d; B: The first month of sorafenib; C: The second month of sorafenib; D: The third month of sorafenib; E: The fourth month of sorafenib; F: The fifth month of sorafenib; Therapeutic response is proved by drops of thyroglobulin, and urine protein-to-creatinine ratio is strongly relative to therapeutic response (Pearson correlation coefficient: 0.94; R2: 0.88; adjusted R2: 0.85).
- Citation: Yang CH, Chen KT, Lin YS, Hsu CY, Ou YC, Tung MC. Improvement of lenvatinib-induced nephrotic syndrome after adaptation to sorafenib in thyroid cancer: A case report. World J Clin Cases 2020; 8(20): 4883-4894
- URL: https://www.wjgnet.com/2307-8960/full/v8/i20/4883.htm
- DOI: https://dx.doi.org/10.12998/wjcc.v8.i20.4883


