Copyright
©The Author(s) 2020.
World J Clin Cases. Jan 26, 2020; 8(2): 313-317
Published online Jan 26, 2020. doi: 10.12998/wjcc.v8.i2.313
Published online Jan 26, 2020. doi: 10.12998/wjcc.v8.i2.313
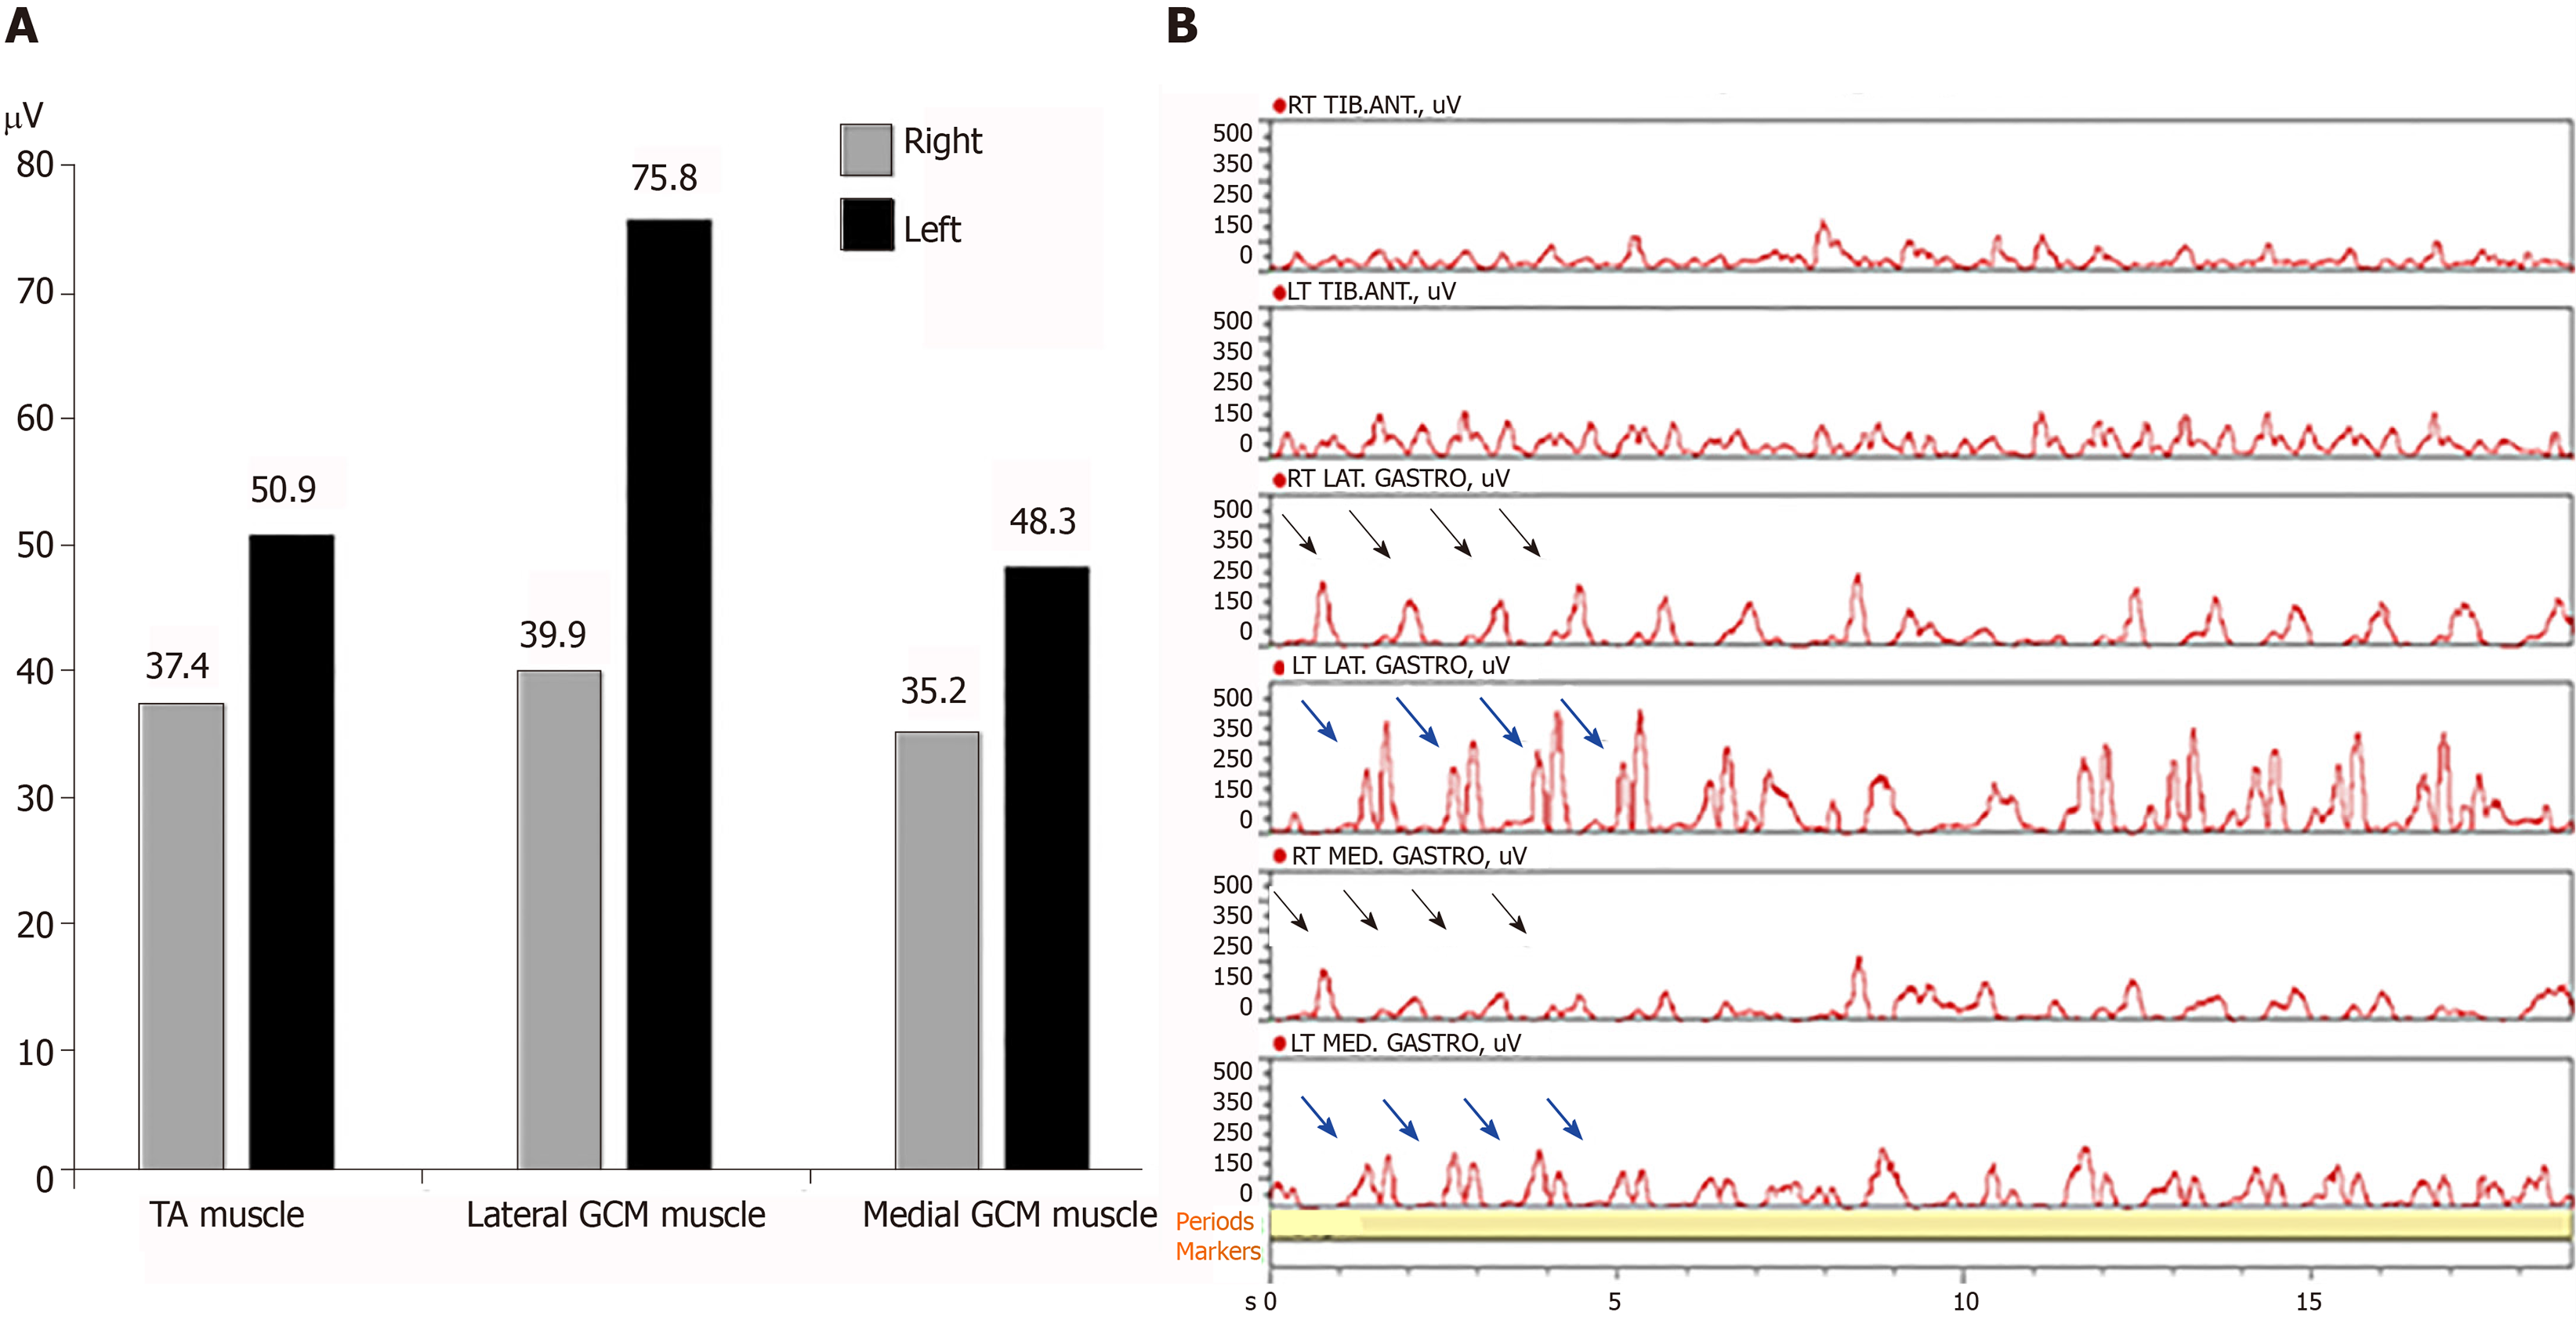
Figure 2 Mean amplitude of a wireless surface electromyography activity and graphic display of analyzed electromyography signals during forward walking.
A: Electromyography (EMG) amplitude of left medial and lateral gastrocnemius (GCM) muscles was larger than right medial and lateral GCM muscles. EMG amplitude of left tibilis anterior (TA) muscle was slightly larger than the one of right TA muscle; B: When we analyzed EMG signals for each muscle during 20 s, there were EMG bursts of double-contraction (blue arrow) in the left medial and lateral GCM muscles, while EMG analysis of right medial and lateral GCM muscles noted regular bursts of single contraction (thin arrow). The bursts of left TA muscle were slightly higher and more than the ones of right TA muscle.
- Citation: Oh MK, Kim HS, Jang YJ, Lee CH. Role of a wireless surface electromyography in dystonic gait in functional movement disorders: A case report. World J Clin Cases 2020; 8(2): 313-317
- URL: https://www.wjgnet.com/2307-8960/full/v8/i2/313.htm
- DOI: https://dx.doi.org/10.12998/wjcc.v8.i2.313


