Copyright
©The Author(s) 2020.
World J Clin Cases. Oct 6, 2020; 8(19): 4512-4520
Published online Oct 6, 2020. doi: 10.12998/wjcc.v8.i19.4512
Published online Oct 6, 2020. doi: 10.12998/wjcc.v8.i19.4512
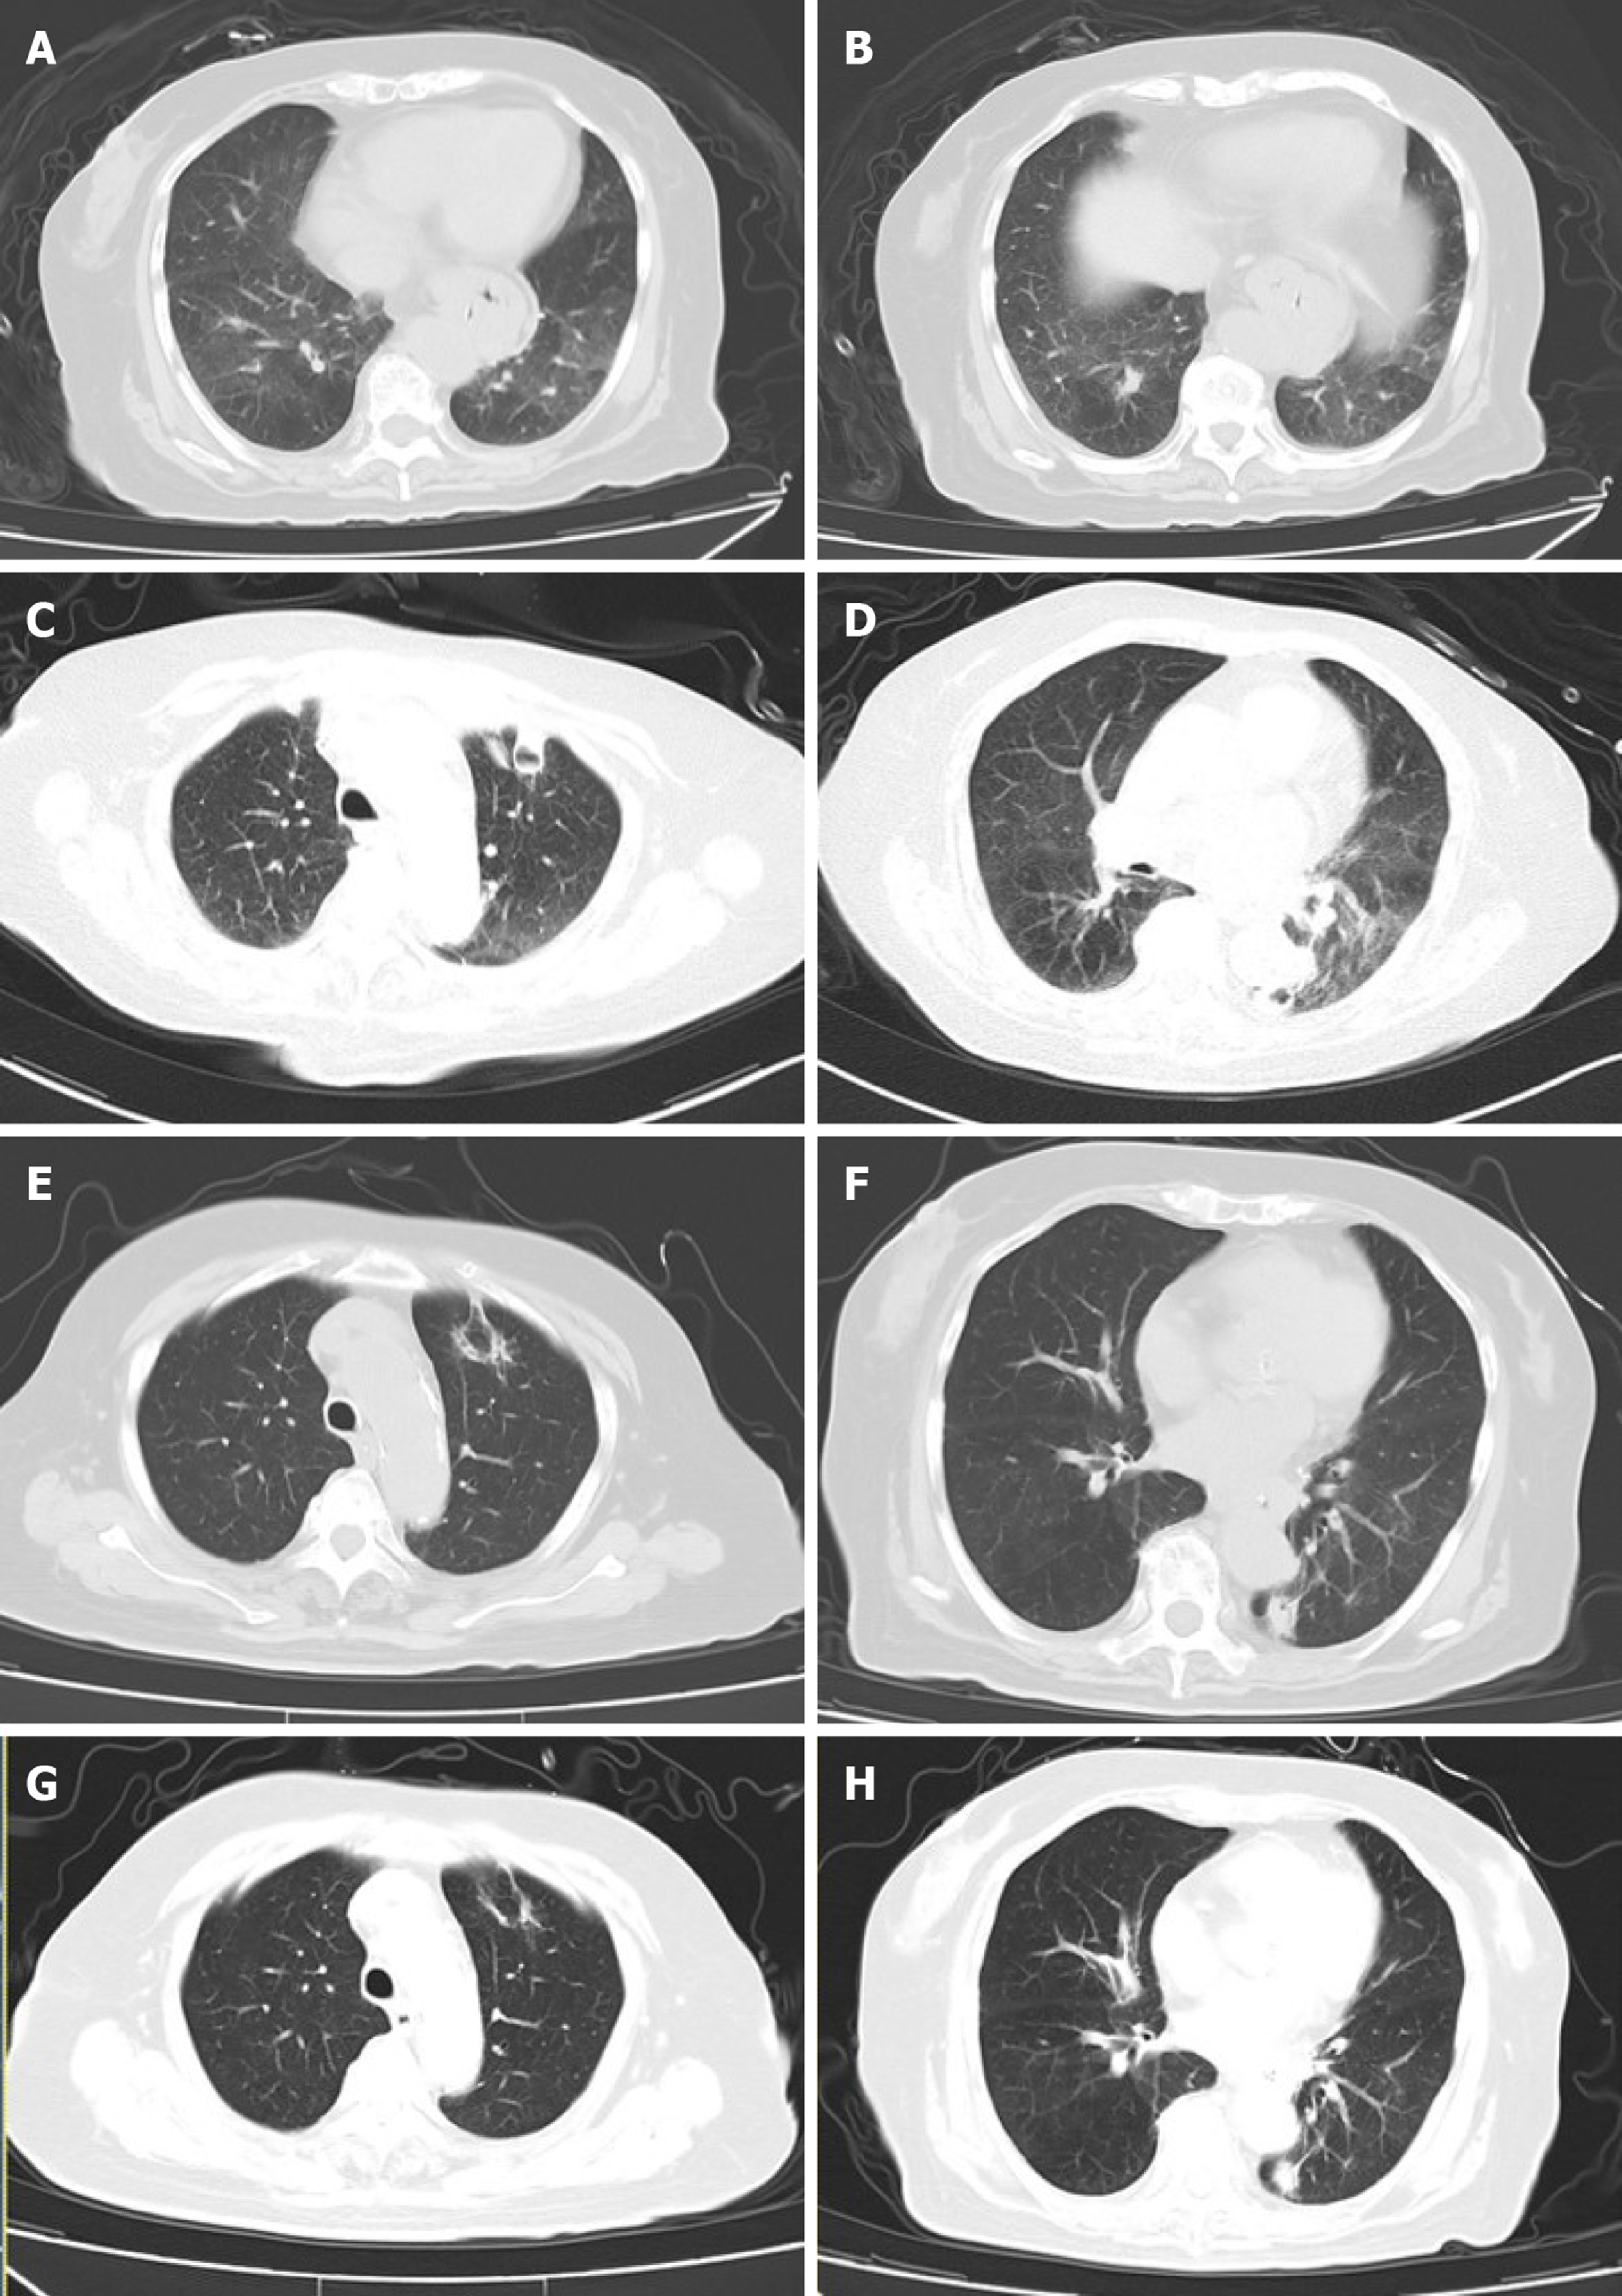
Figure 4 Axial computed tomography of the chest during the disease course.
A and B: Chest computed tomography at initial presentation showed diffuse patchy infiltration of both lungs; C and D: Two thick-walled crescent hollows in the right upper and lower lungs after septic shock; E and F: Absorption of the two hollows after two weeks of intravenous voriconazole; G and H: Further absorption of the two hollows without new infiltration during the second phase of airway hyperresponsiveness.
- Citation: Zhang BQ, Dai XY, Ye QY, Chang L, Wang ZW, Li XQ, Li YN. Spontaneous resolution of idiopathic intestinal obstruction after pneumonia: A case report. World J Clin Cases 2020; 8(19): 4512-4520
- URL: https://www.wjgnet.com/2307-8960/full/v8/i19/4512.htm
- DOI: https://dx.doi.org/10.12998/wjcc.v8.i19.4512


