Copyright
©The Author(s) 2020.
World J Clin Cases. Sep 6, 2020; 8(17): 3730-3742
Published online Sep 6, 2020. doi: 10.12998/wjcc.v8.i17.3730
Published online Sep 6, 2020. doi: 10.12998/wjcc.v8.i17.3730
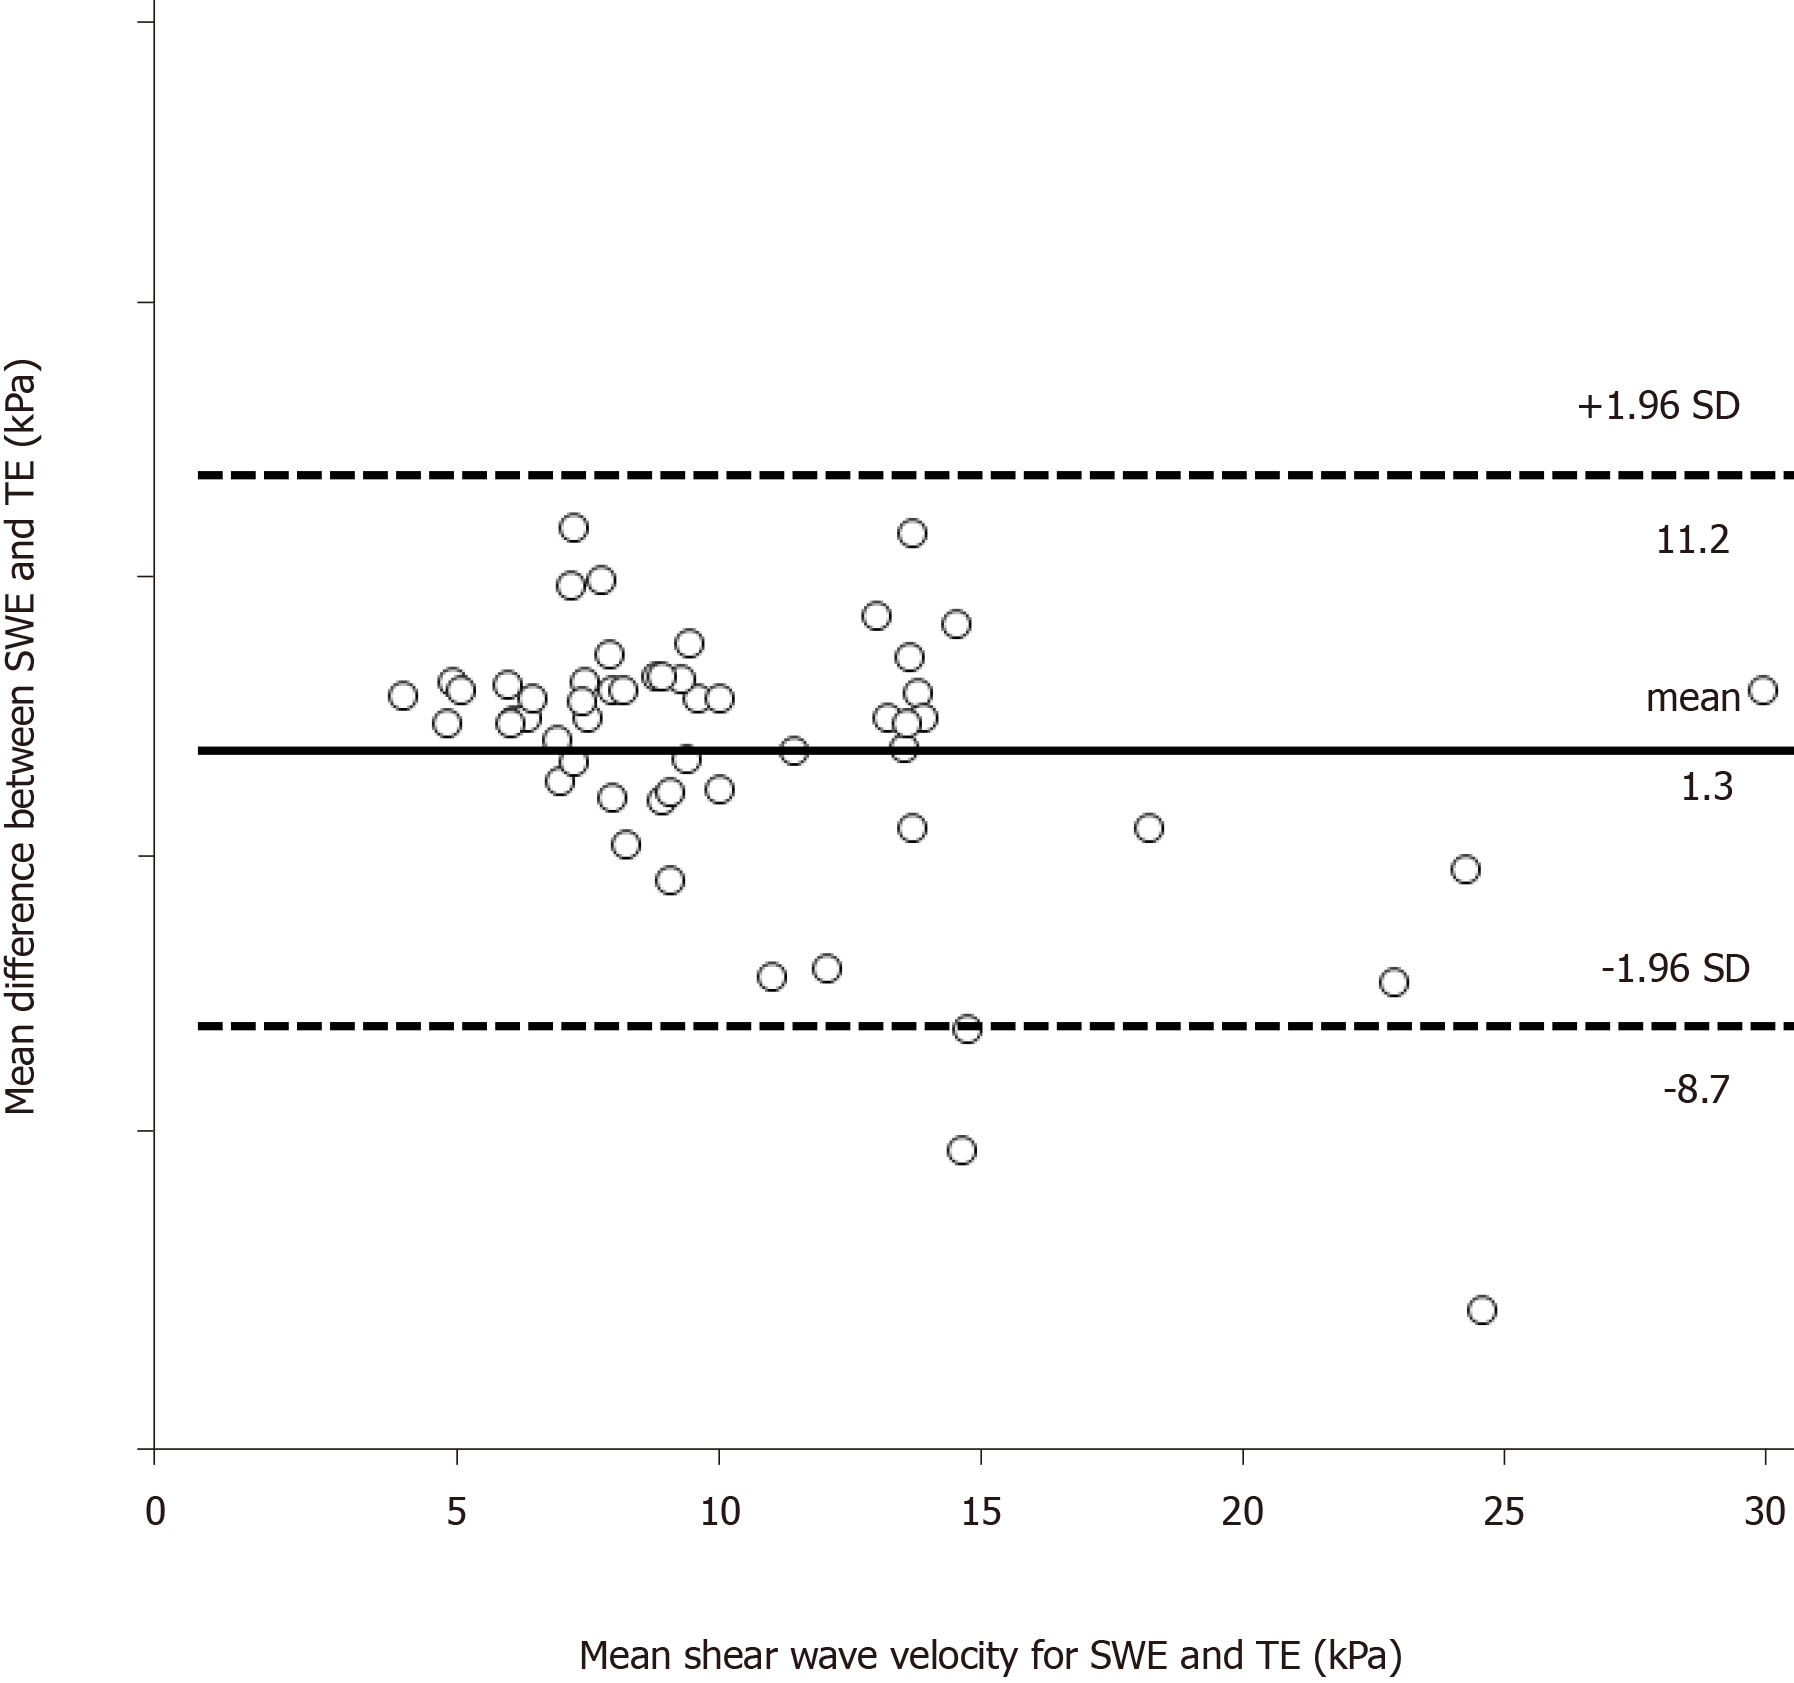
Figure 2 Bland-Altman analysis: Agreement between liver stiffness measurements obtained with shear wave elastography and transient elastography.
The abscissa shows the mean of the two measurement methods, and the ordinate shows the difference between the two measurement methods. A: The solid line represents the mean of the difference in shear wave velocity of shear wave elastography (SWE), the dashed lines represent the 95% upper and lower limits of agreement of SWE; B: The solid line represents the mean of the difference in shear wave velocity of transient elastography (TE), the dashed lines represent the 95% upper and lower limits of agreement of TE. SWE: Shear wave elastography; TE: Transient elastography.
- Citation: Yao TT, Pan J, Qian JD, Cheng H, Wang Y, Wang GQ. Shear wave elastography may be sensitive and more precise than transient elastography in predicting significant fibrosis. World J Clin Cases 2020; 8(17): 3730-3742
- URL: https://www.wjgnet.com/2307-8960/full/v8/i17/3730.htm
- DOI: https://dx.doi.org/10.12998/wjcc.v8.i17.3730


