Copyright
©The Author(s) 2020.
World J Clin Cases. Sep 6, 2020; 8(17): 3730-3742
Published online Sep 6, 2020. doi: 10.12998/wjcc.v8.i17.3730
Published online Sep 6, 2020. doi: 10.12998/wjcc.v8.i17.3730
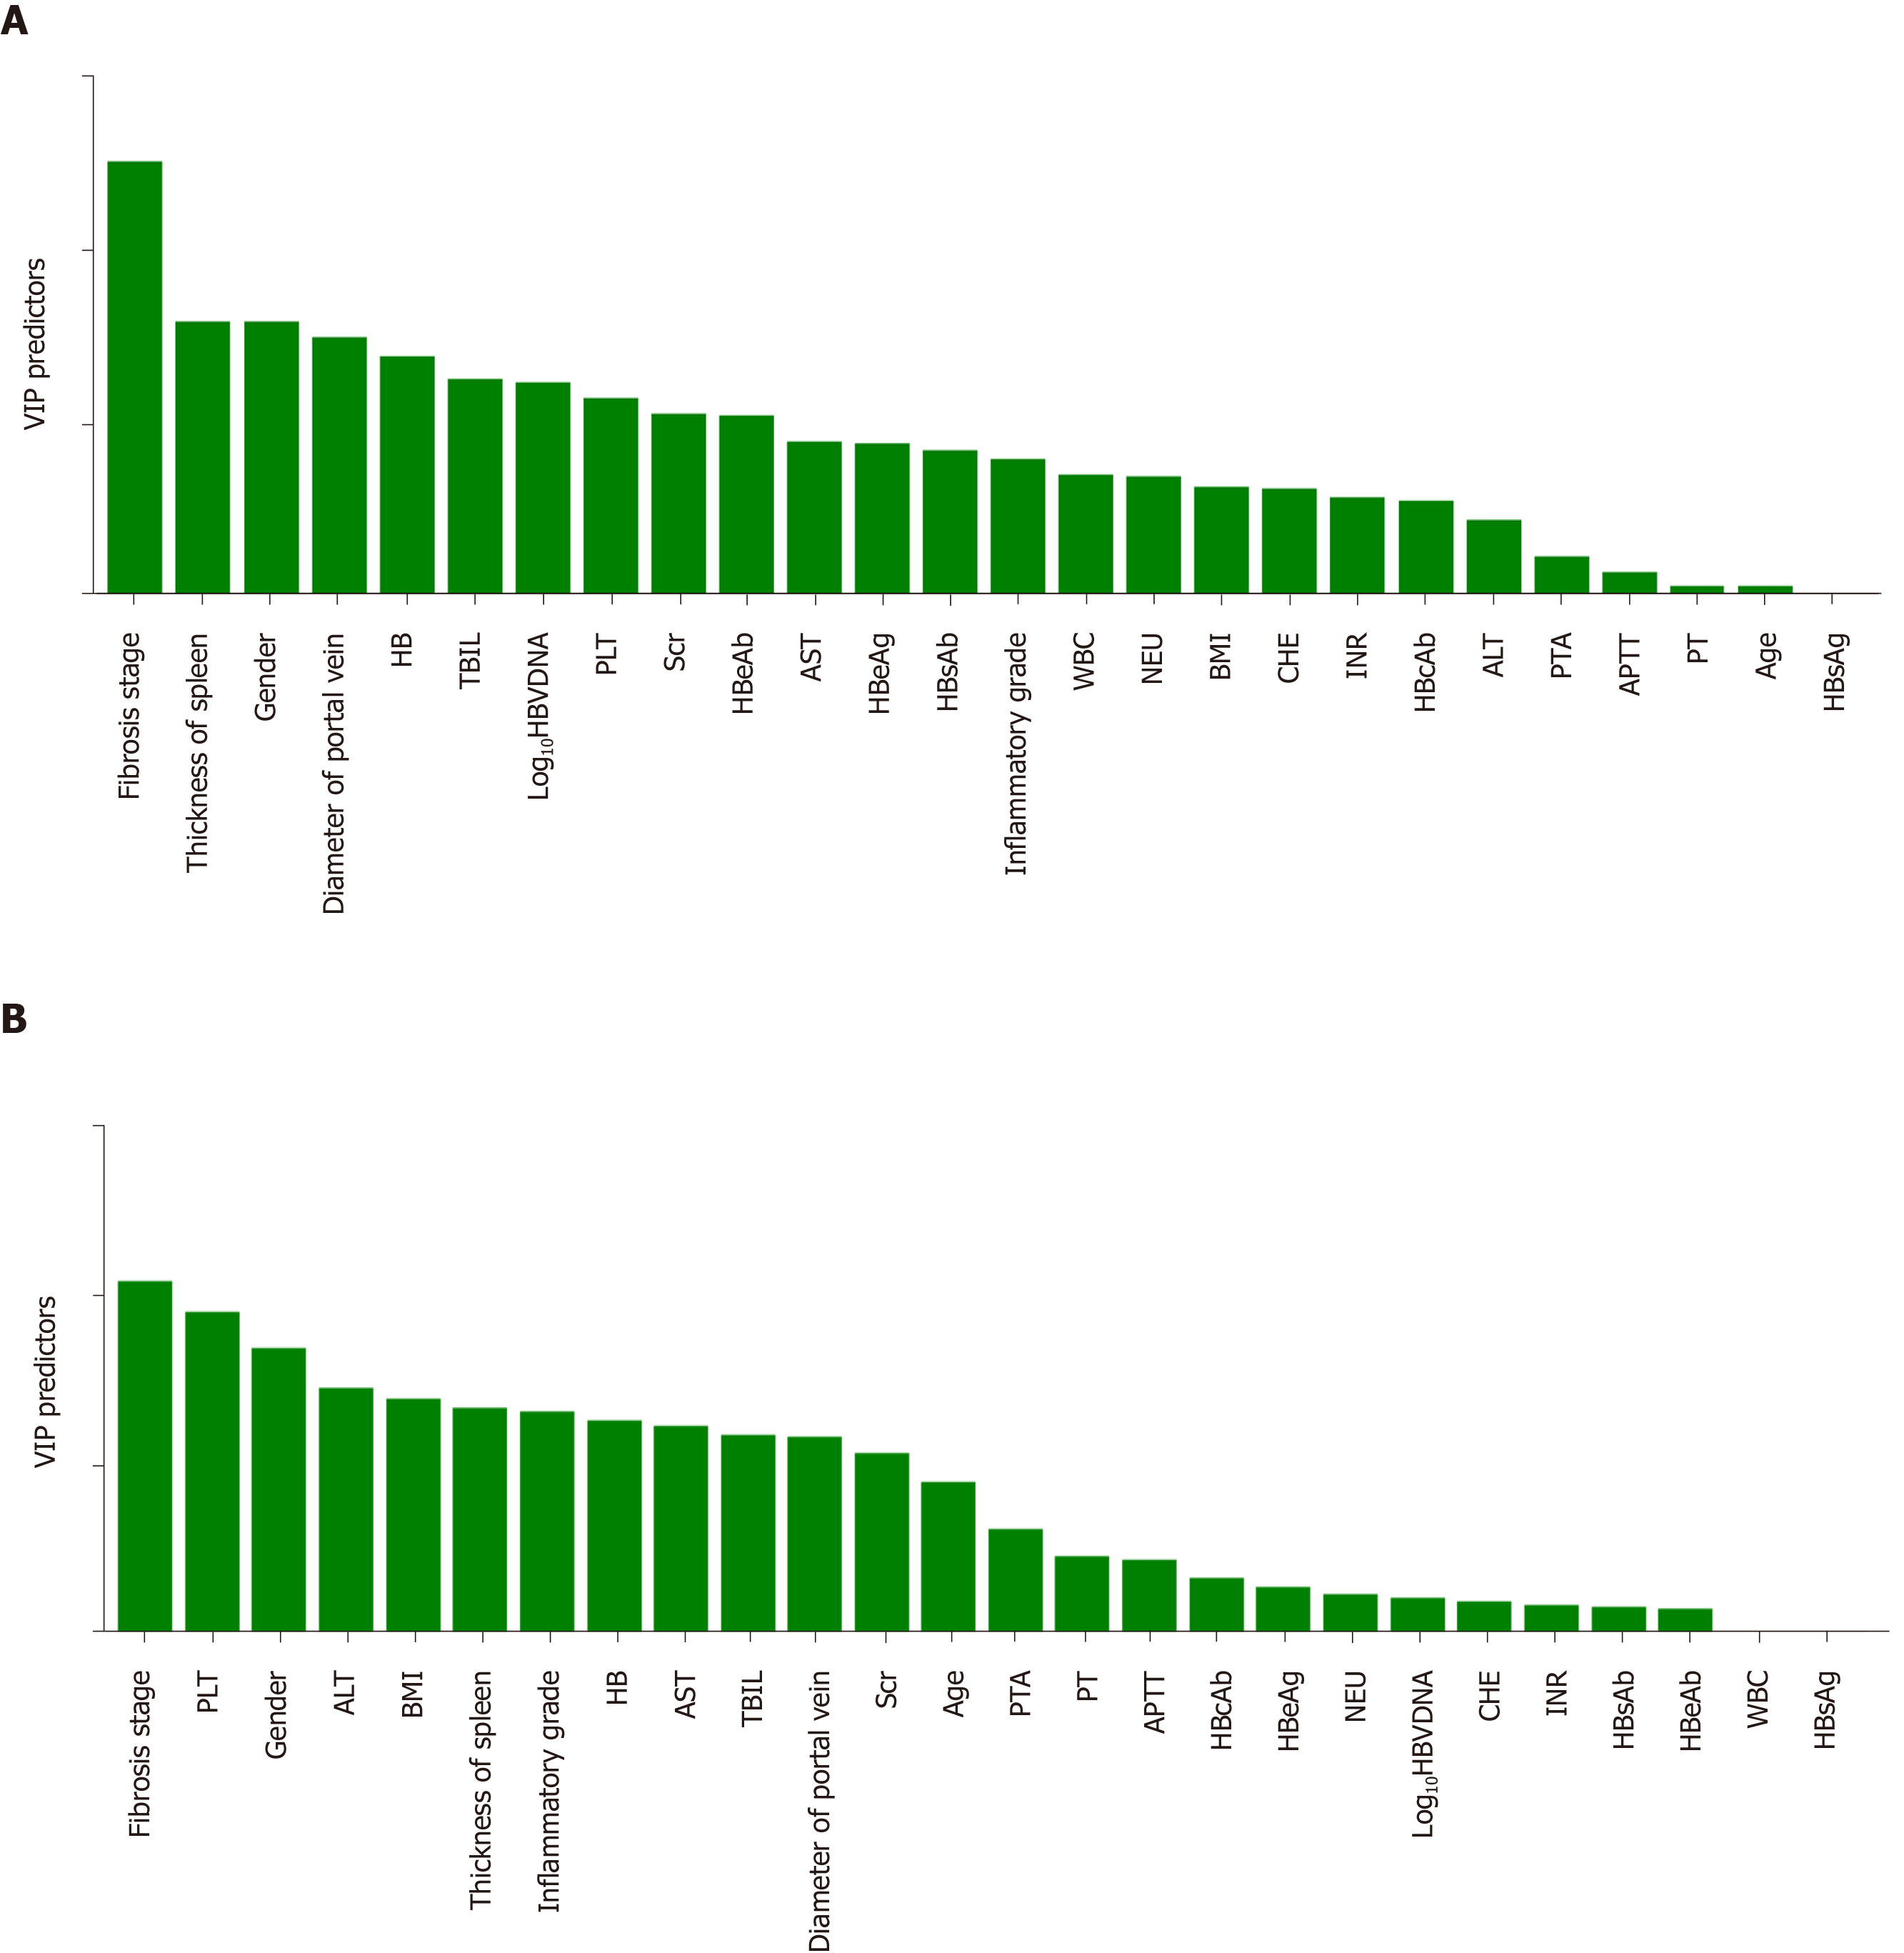
Figure 1 Results of orthogonal partial least squares discriminant analysis.
The abscissa indicates various factors and is arranged from left to right according to the influence on liver stiffness measurements. The ordinate shows the VIP value, which represents the power of the effect. A: The results of orthogonal partial least squares (OPLS) discriminant analysis of shear wave elastography; B: The results of OPLS discriminant analysis of transient elastography. HB: Hemoglobin; TBIL: Total bilirubin; PLT: Platelet; AST: Aspartate aminotransferase; HBeAb: Hepatitis B e antibody; HBeAg: Hepatitis B e antigen; HBsAb: Hepatitis B surface antibody; HBsAg: Hepatitis B surface antigen; HBV-DNA: Hepatitis B virus DNA; WBC: White blood cell; NEU: Neutrophils; BMI: Body mass index; CHE: Cholinesterase; INR: International normalized ratio; ALT: Alanine aminotransferase; PTA: Prothrombin activity; APTT: Activated partial thromboplastin time; PT: Prothrombin time.
- Citation: Yao TT, Pan J, Qian JD, Cheng H, Wang Y, Wang GQ. Shear wave elastography may be sensitive and more precise than transient elastography in predicting significant fibrosis. World J Clin Cases 2020; 8(17): 3730-3742
- URL: https://www.wjgnet.com/2307-8960/full/v8/i17/3730.htm
- DOI: https://dx.doi.org/10.12998/wjcc.v8.i17.3730


