Copyright
©The Author(s) 2020.
World J Clin Cases. Aug 6, 2020; 8(15): 3249-3258
Published online Aug 6, 2020. doi: 10.12998/wjcc.v8.i15.3249
Published online Aug 6, 2020. doi: 10.12998/wjcc.v8.i15.3249
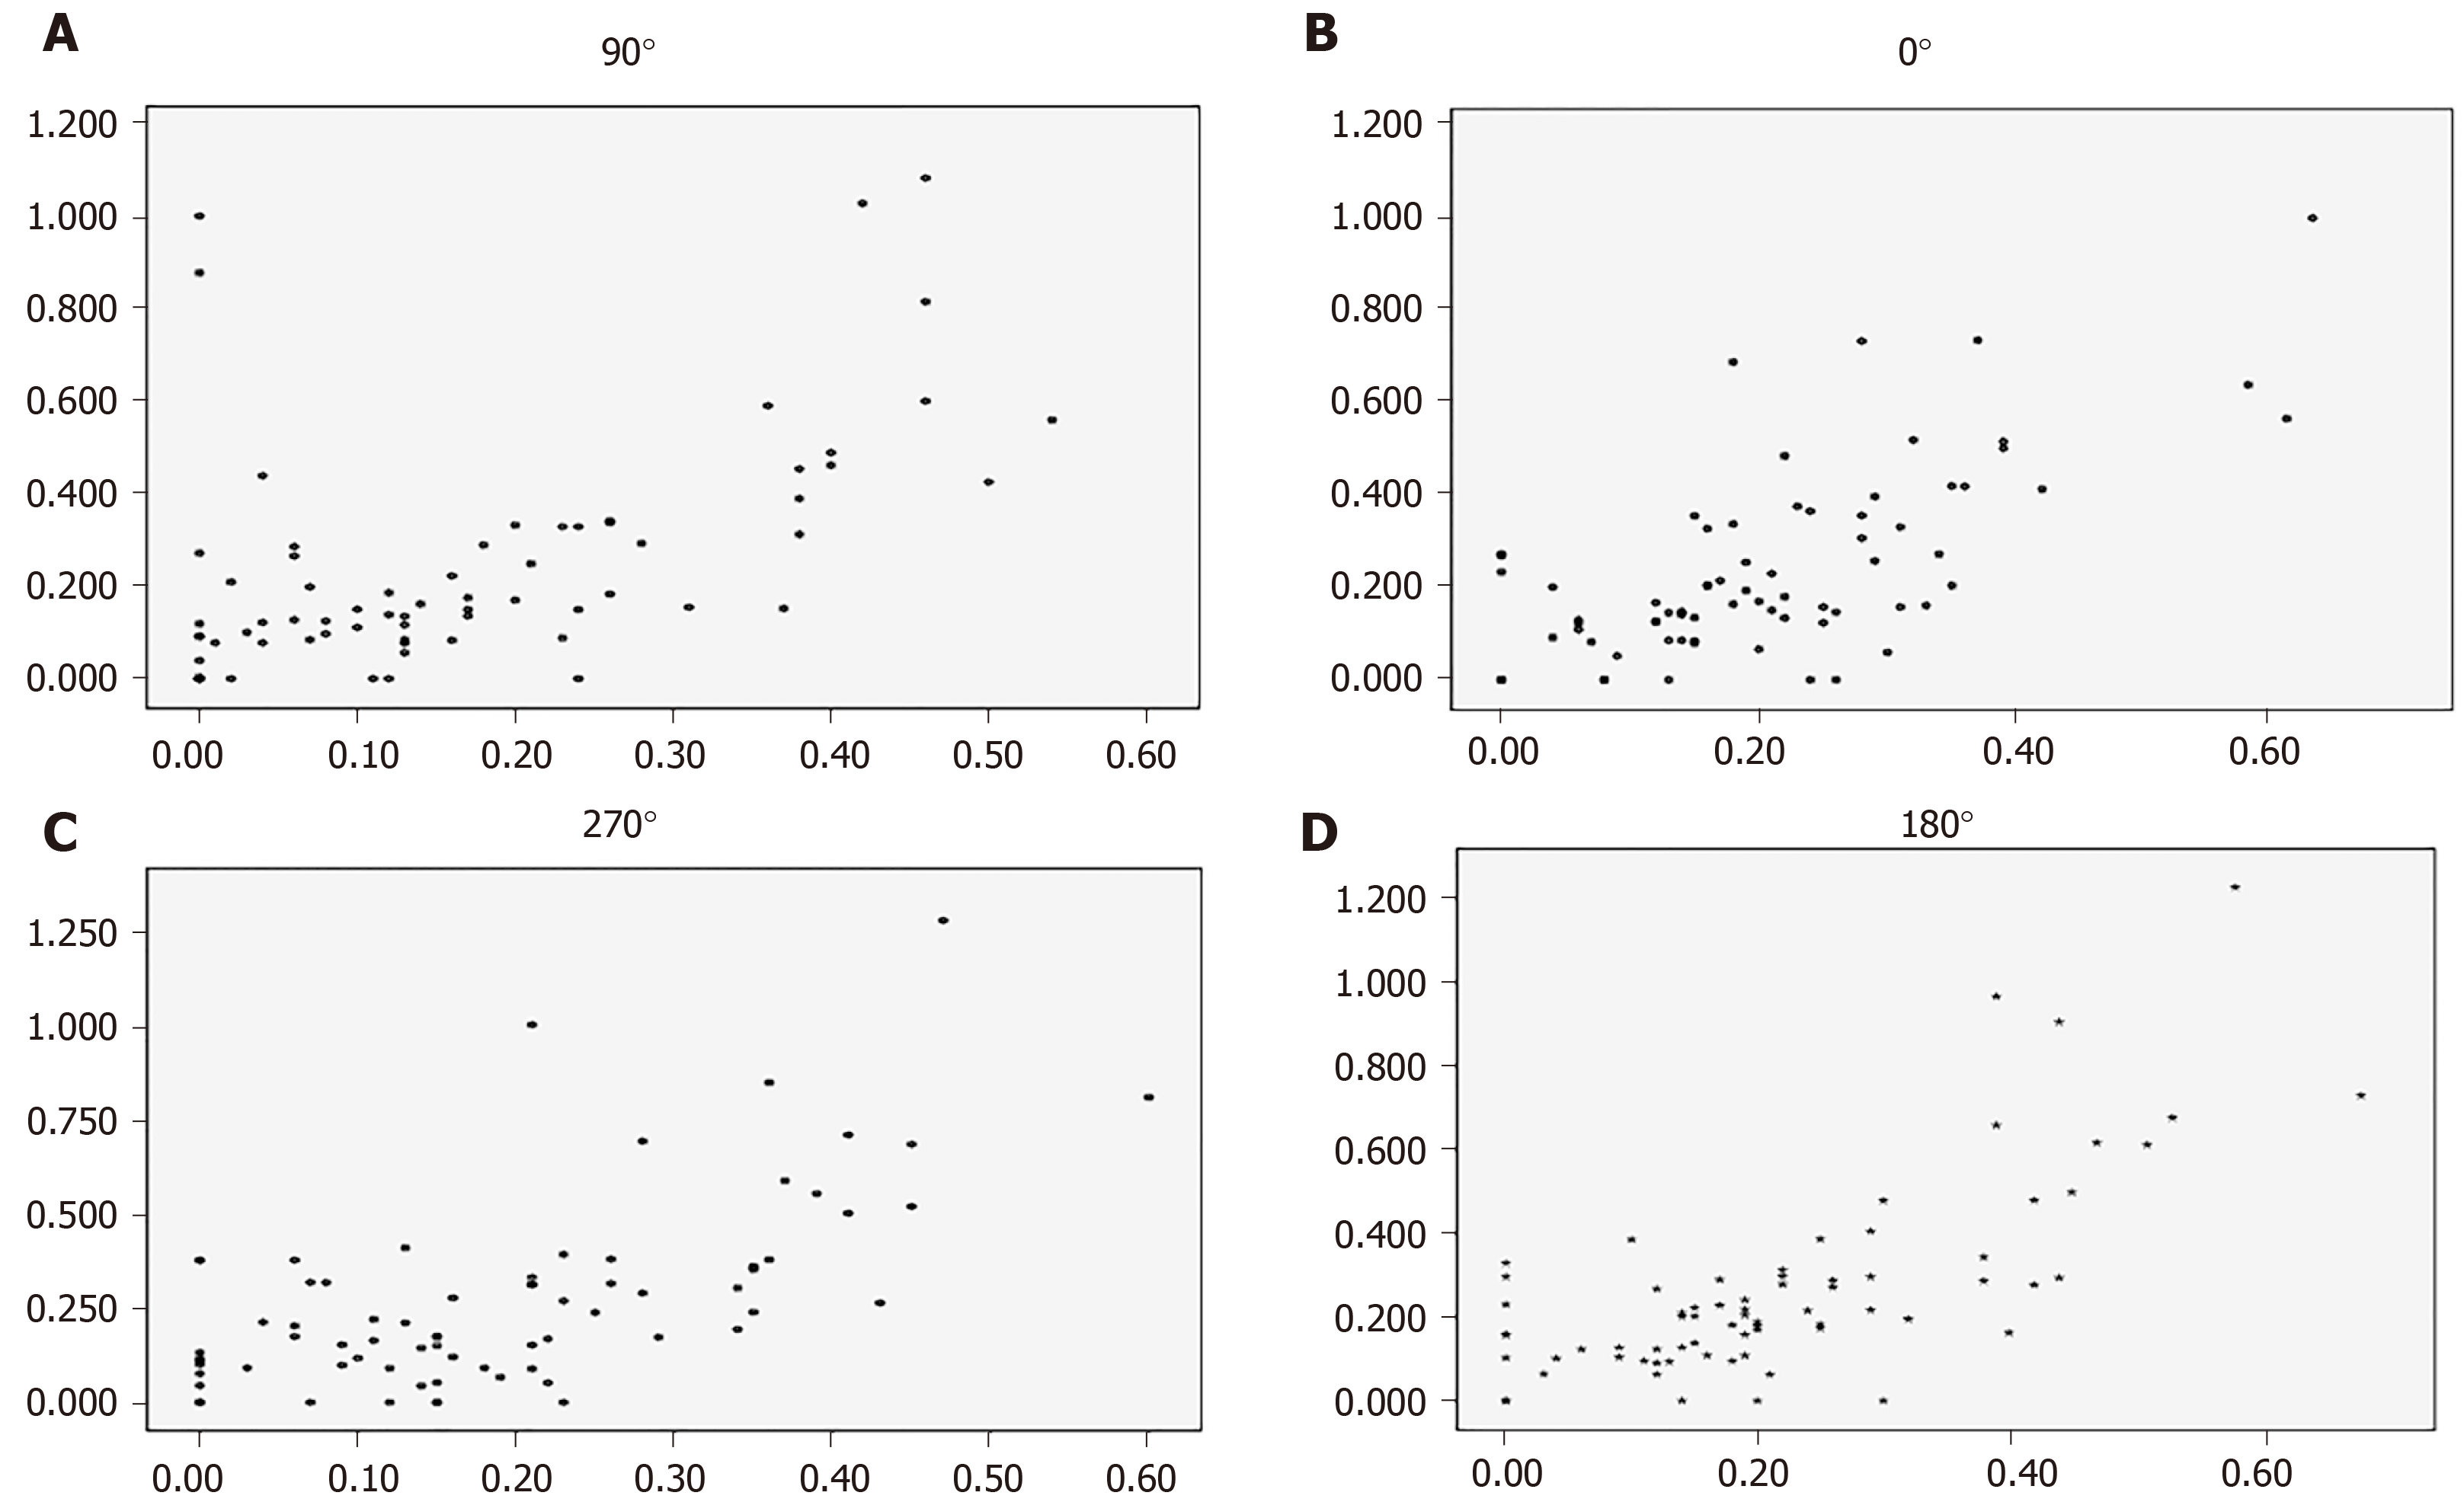
Figure 1 Correlation diagrams of angel opening distance at 500 μm measured by the two instruments of the four quadrants of the chamber angles.
The X axis represents ultrasound biomicroscopy. The Y axis represents anterior segment optical coherence tomography. A: At 90 °; B: At 0 °; C: At 270 °; D: At 180 °.
- Citation: Yu ZY, Huang T, Lu L, Qu B. Comparison of measurements of anterior chamber angle via anterior segment optical coherence tomography and ultrasound biomicroscopy. World J Clin Cases 2020; 8(15): 3249-3258
- URL: https://www.wjgnet.com/2307-8960/full/v8/i15/3249.htm
- DOI: https://dx.doi.org/10.12998/wjcc.v8.i15.3249


