Copyright
©The Author(s) 2020.
World J Clin Cases. Aug 6, 2020; 8(15): 3197-3208
Published online Aug 6, 2020. doi: 10.12998/wjcc.v8.i15.3197
Published online Aug 6, 2020. doi: 10.12998/wjcc.v8.i15.3197
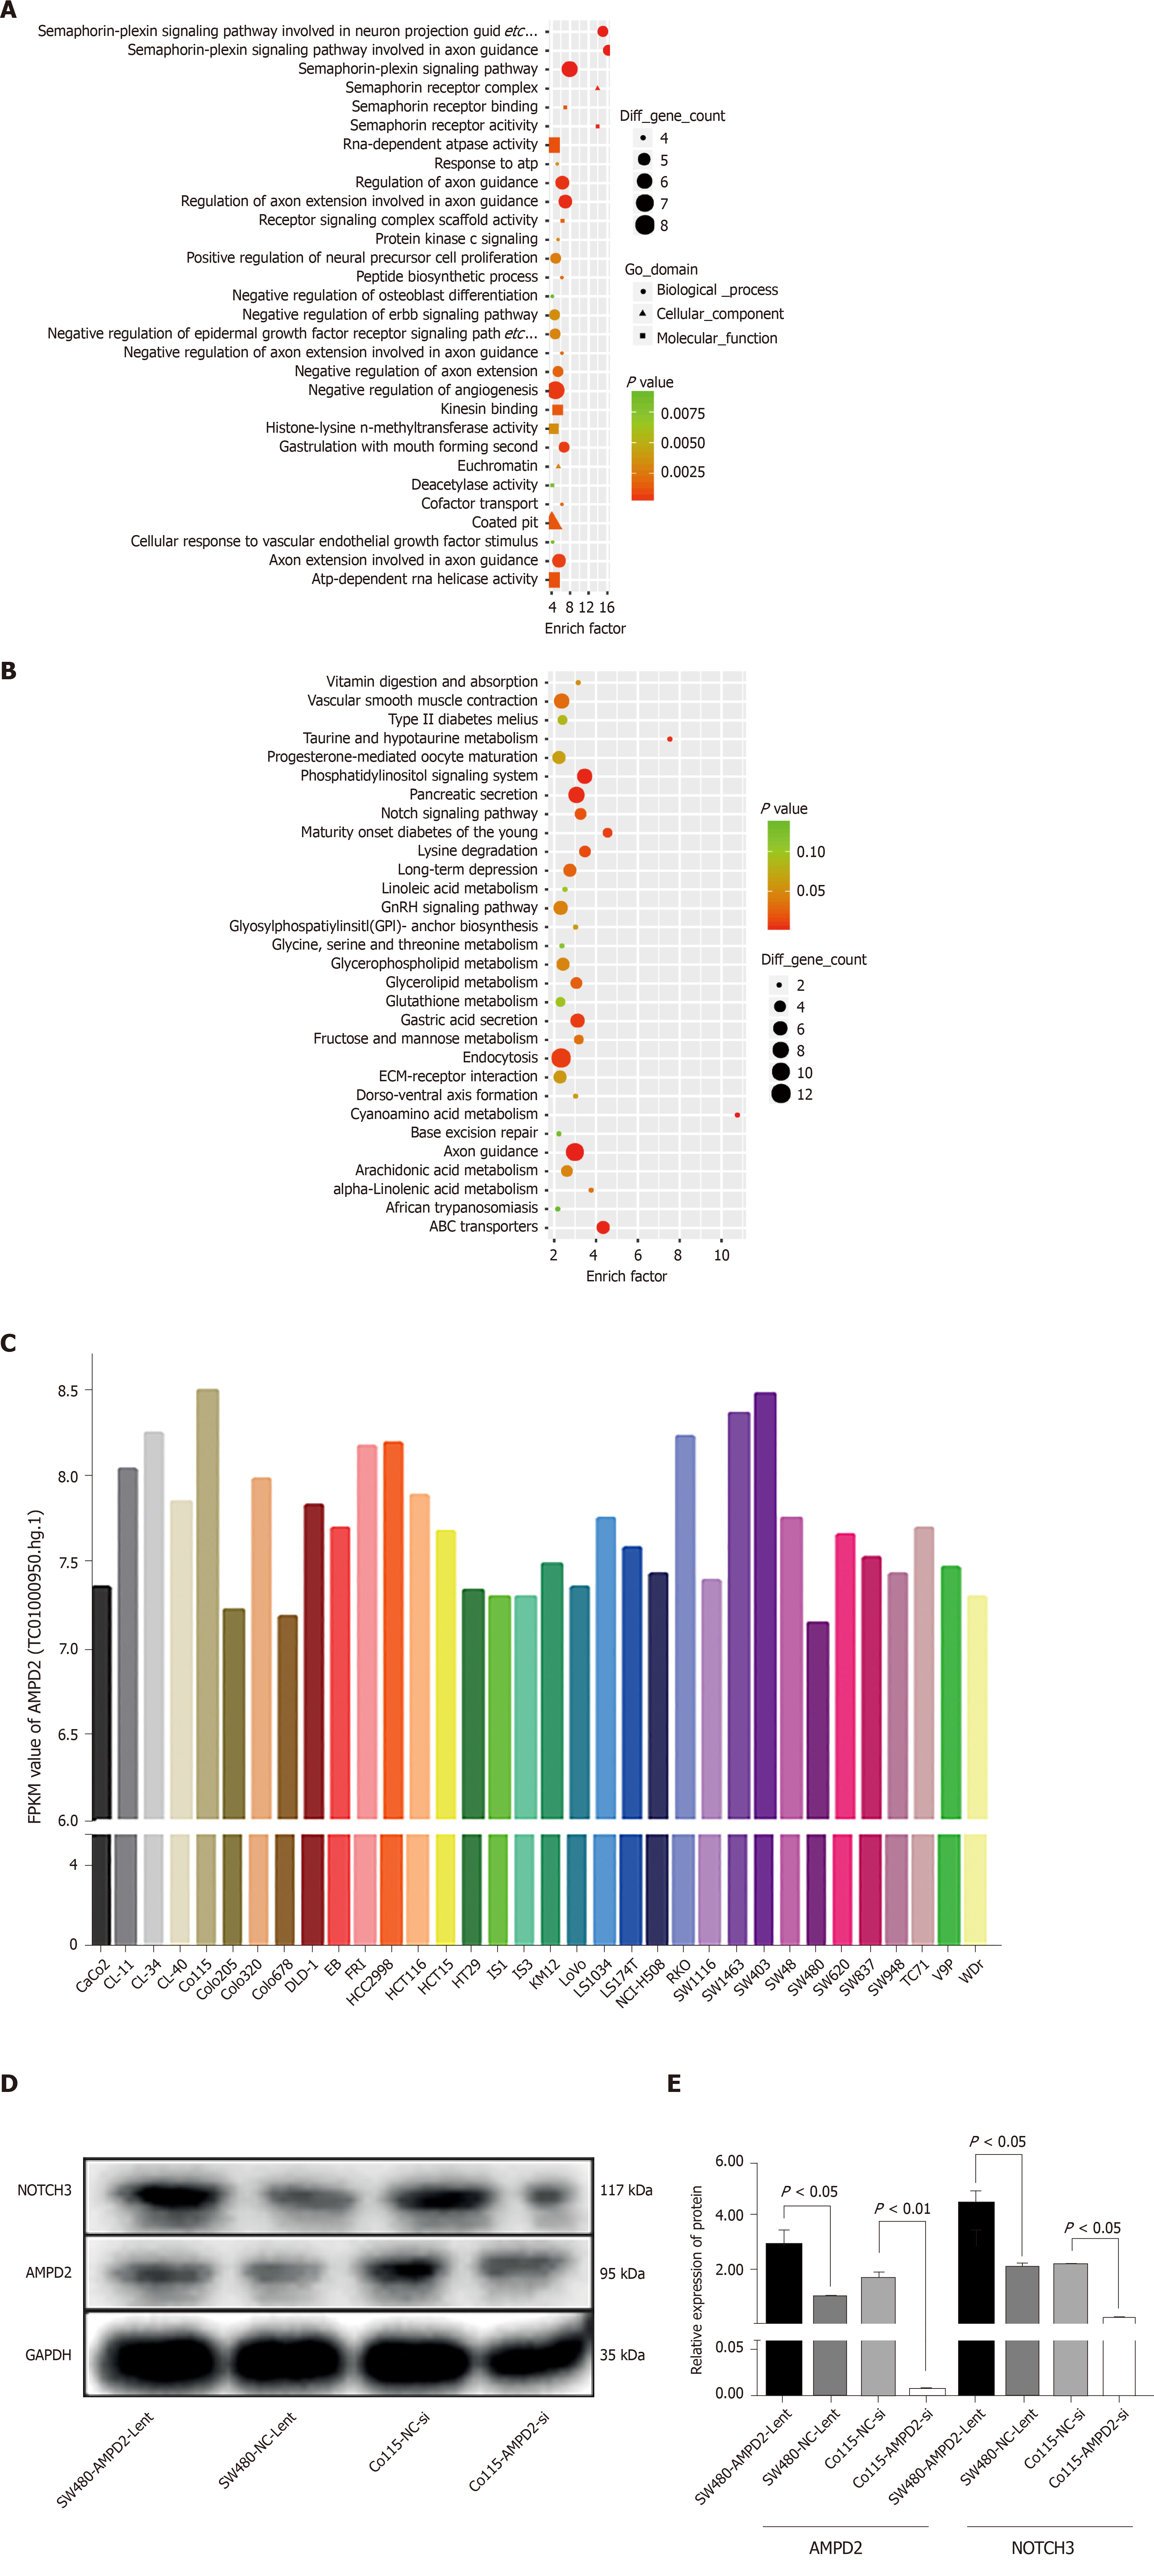
Figure 2 Functional enrichment analysis and western blot.
A and B: Based on AMPD2, a high expression subgroup (50 cases) and a low expression subgroup (50 cases) in cancer tissues were identified, and functional enrichment analysis of gene expression differences was performed using GO and KEGG maps; C: The expression of AMPD2 in various colorectal cancer cell lines was analyzed according to the GEO-GSE97023 data set; D and E: The Western blot results of up-regulation and down-regulation of AMPD2 in SW480 and Co115 cell lines, immunoblotting (D) and histogram (E).
- Citation: Gao QZ, Qin Y, Wang WJ, Fei BJ, Han WF, Jin JQ, Gao X. Overexpression of AMPD2 indicates poor prognosis in colorectal cancer patients via the Notch3 signaling pathway. World J Clin Cases 2020; 8(15): 3197-3208
- URL: https://www.wjgnet.com/2307-8960/full/v8/i15/3197.htm
- DOI: https://dx.doi.org/10.12998/wjcc.v8.i15.3197


