Copyright
©The Author(s) 2020.
World J Clin Cases. Aug 6, 2020; 8(15): 3197-3208
Published online Aug 6, 2020. doi: 10.12998/wjcc.v8.i15.3197
Published online Aug 6, 2020. doi: 10.12998/wjcc.v8.i15.3197
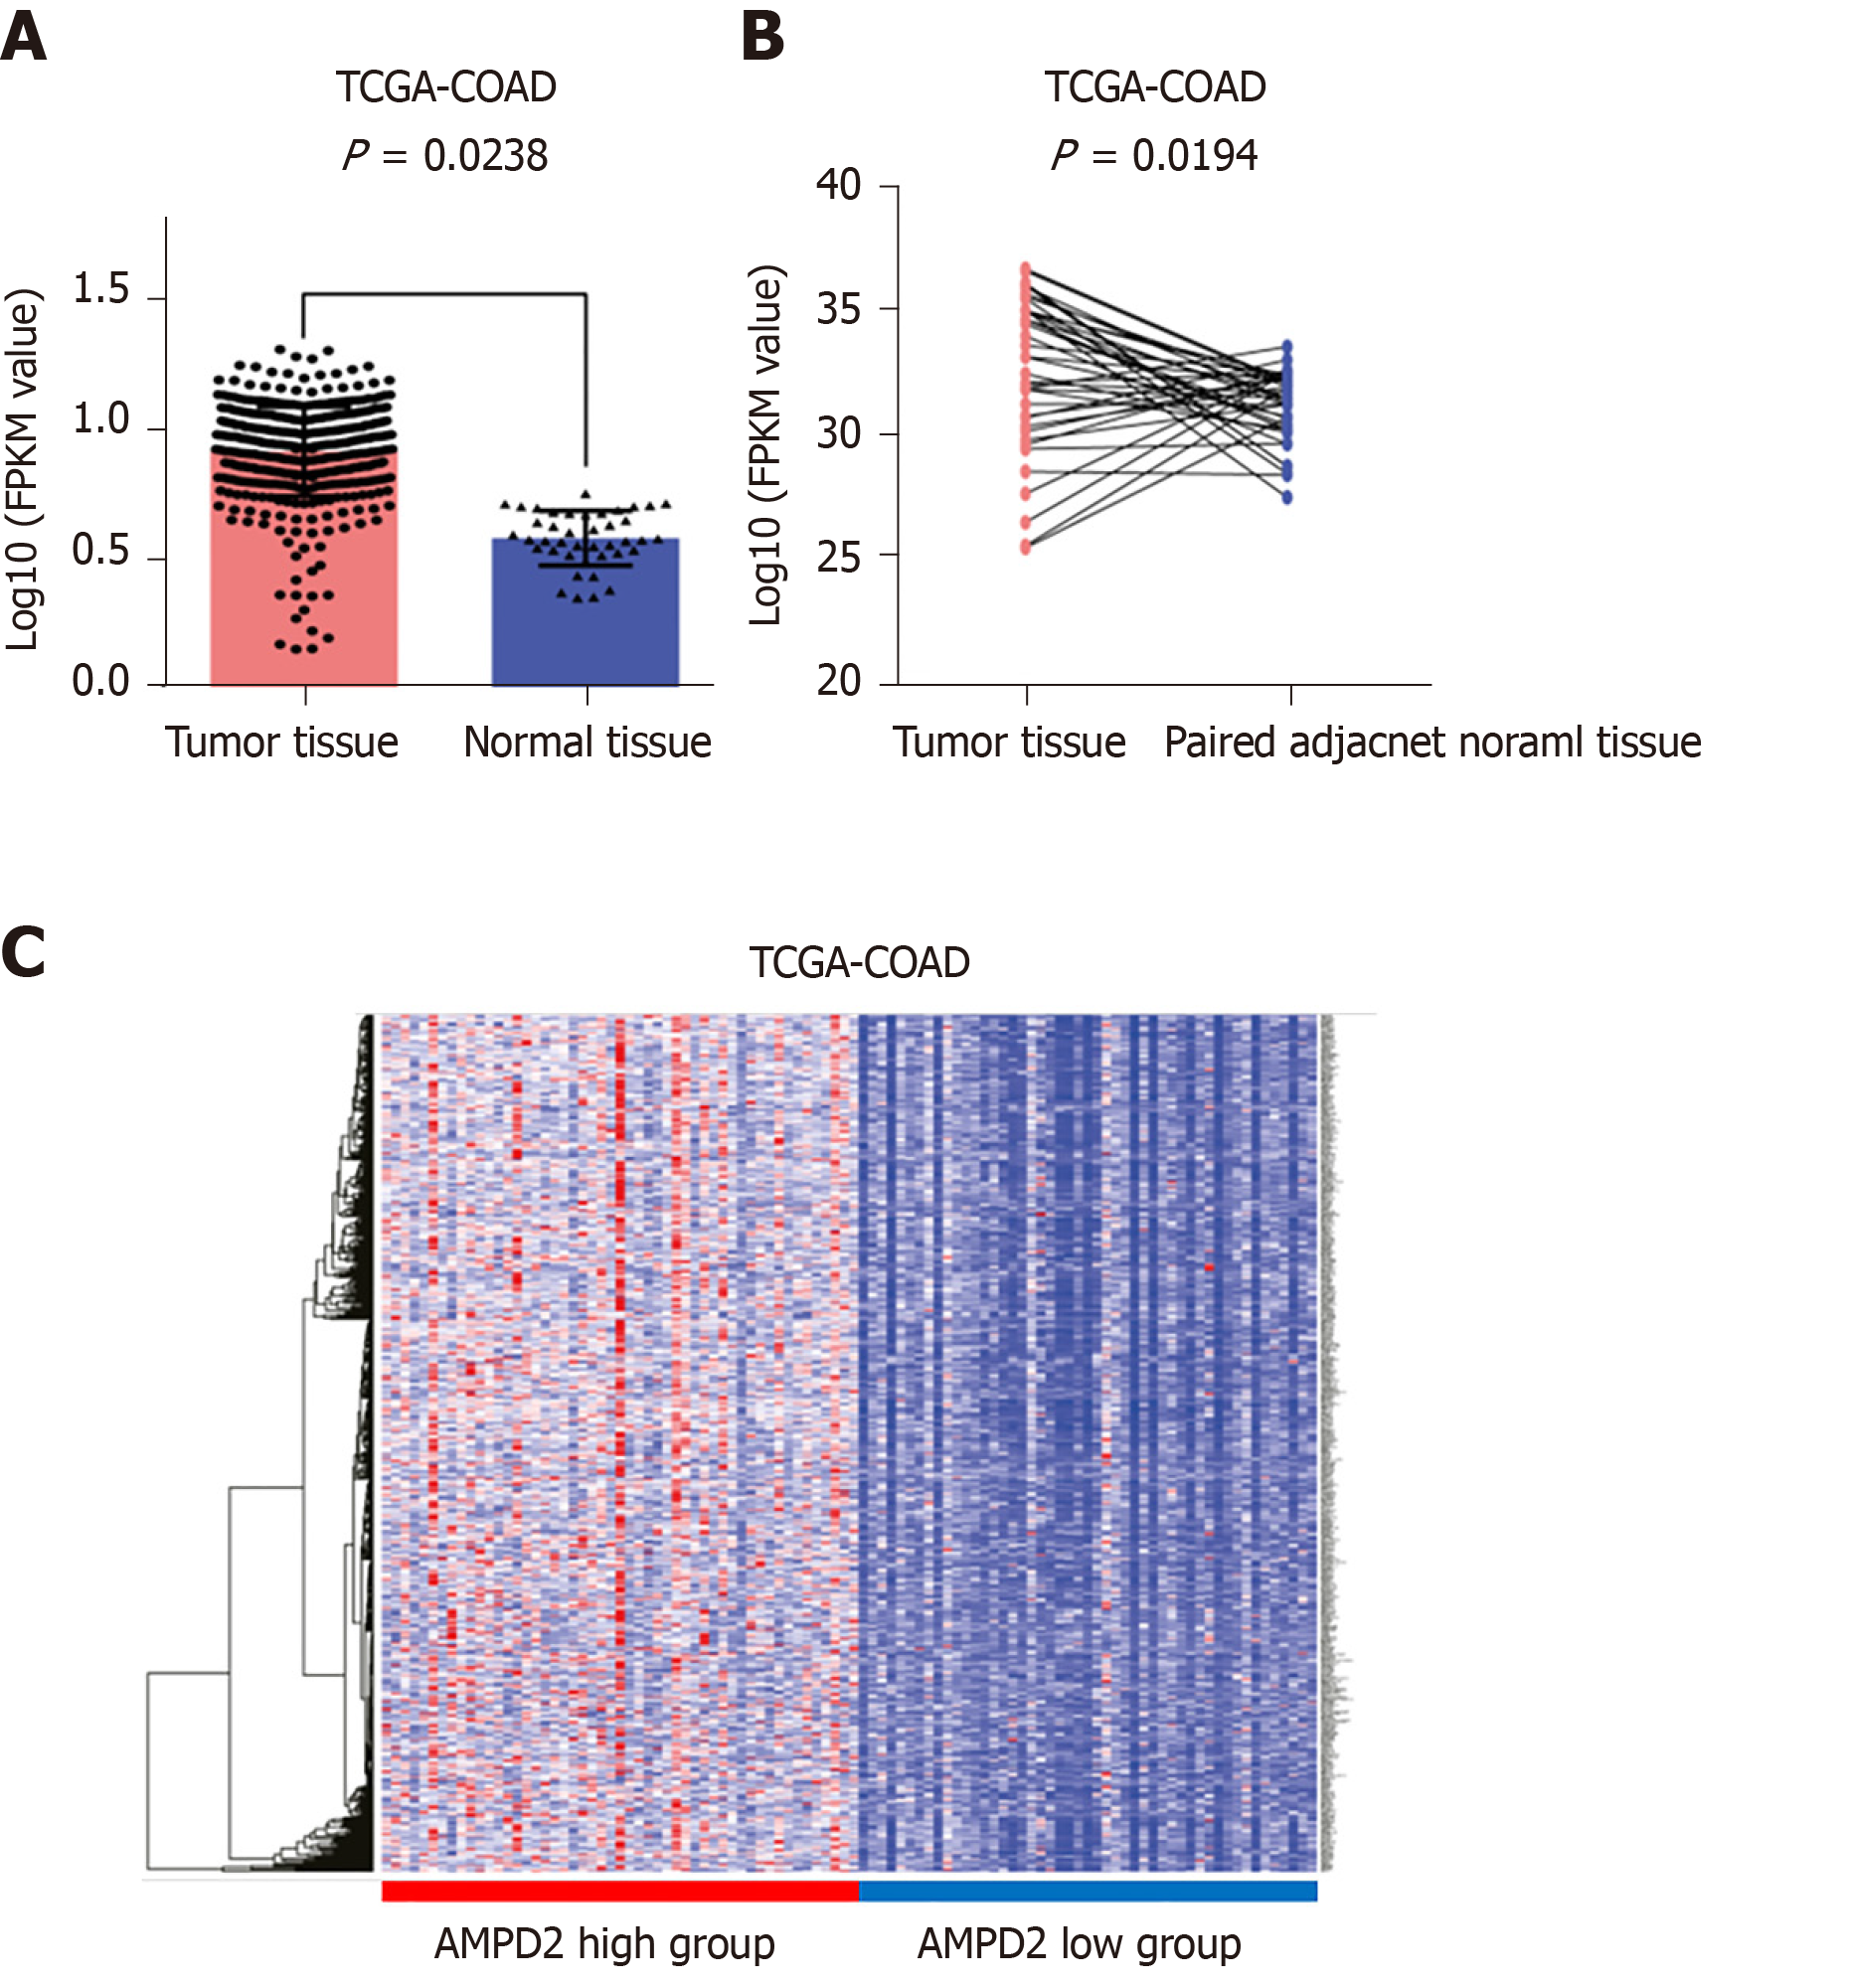
Figure 1 The expression level of AMPD2 in the TCGA-COAD data set.
A: The expression level of AMPD2 in cancer tissues and paracancerous tissues was determined by two independent samples t test, P < 0.05 was considered significant; B: In paired samples of cancer tissue and adjacent normal tissues, the AMPD2 expression level was determined by paired t-test, and P < 0.05 was considered significant; C: AMPD2-based high expression subgroup (50 cases) and low expression subgroup (50 cases) in cancer tissues. A heat map of the difference in gene expression was produced.
- Citation: Gao QZ, Qin Y, Wang WJ, Fei BJ, Han WF, Jin JQ, Gao X. Overexpression of AMPD2 indicates poor prognosis in colorectal cancer patients via the Notch3 signaling pathway. World J Clin Cases 2020; 8(15): 3197-3208
- URL: https://www.wjgnet.com/2307-8960/full/v8/i15/3197.htm
- DOI: https://dx.doi.org/10.12998/wjcc.v8.i15.3197


