Copyright
©The Author(s) 2020.
World J Clin Cases. Jul 26, 2020; 8(14): 3114-3121
Published online Jul 26, 2020. doi: 10.12998/wjcc.v8.i14.3114
Published online Jul 26, 2020. doi: 10.12998/wjcc.v8.i14.3114
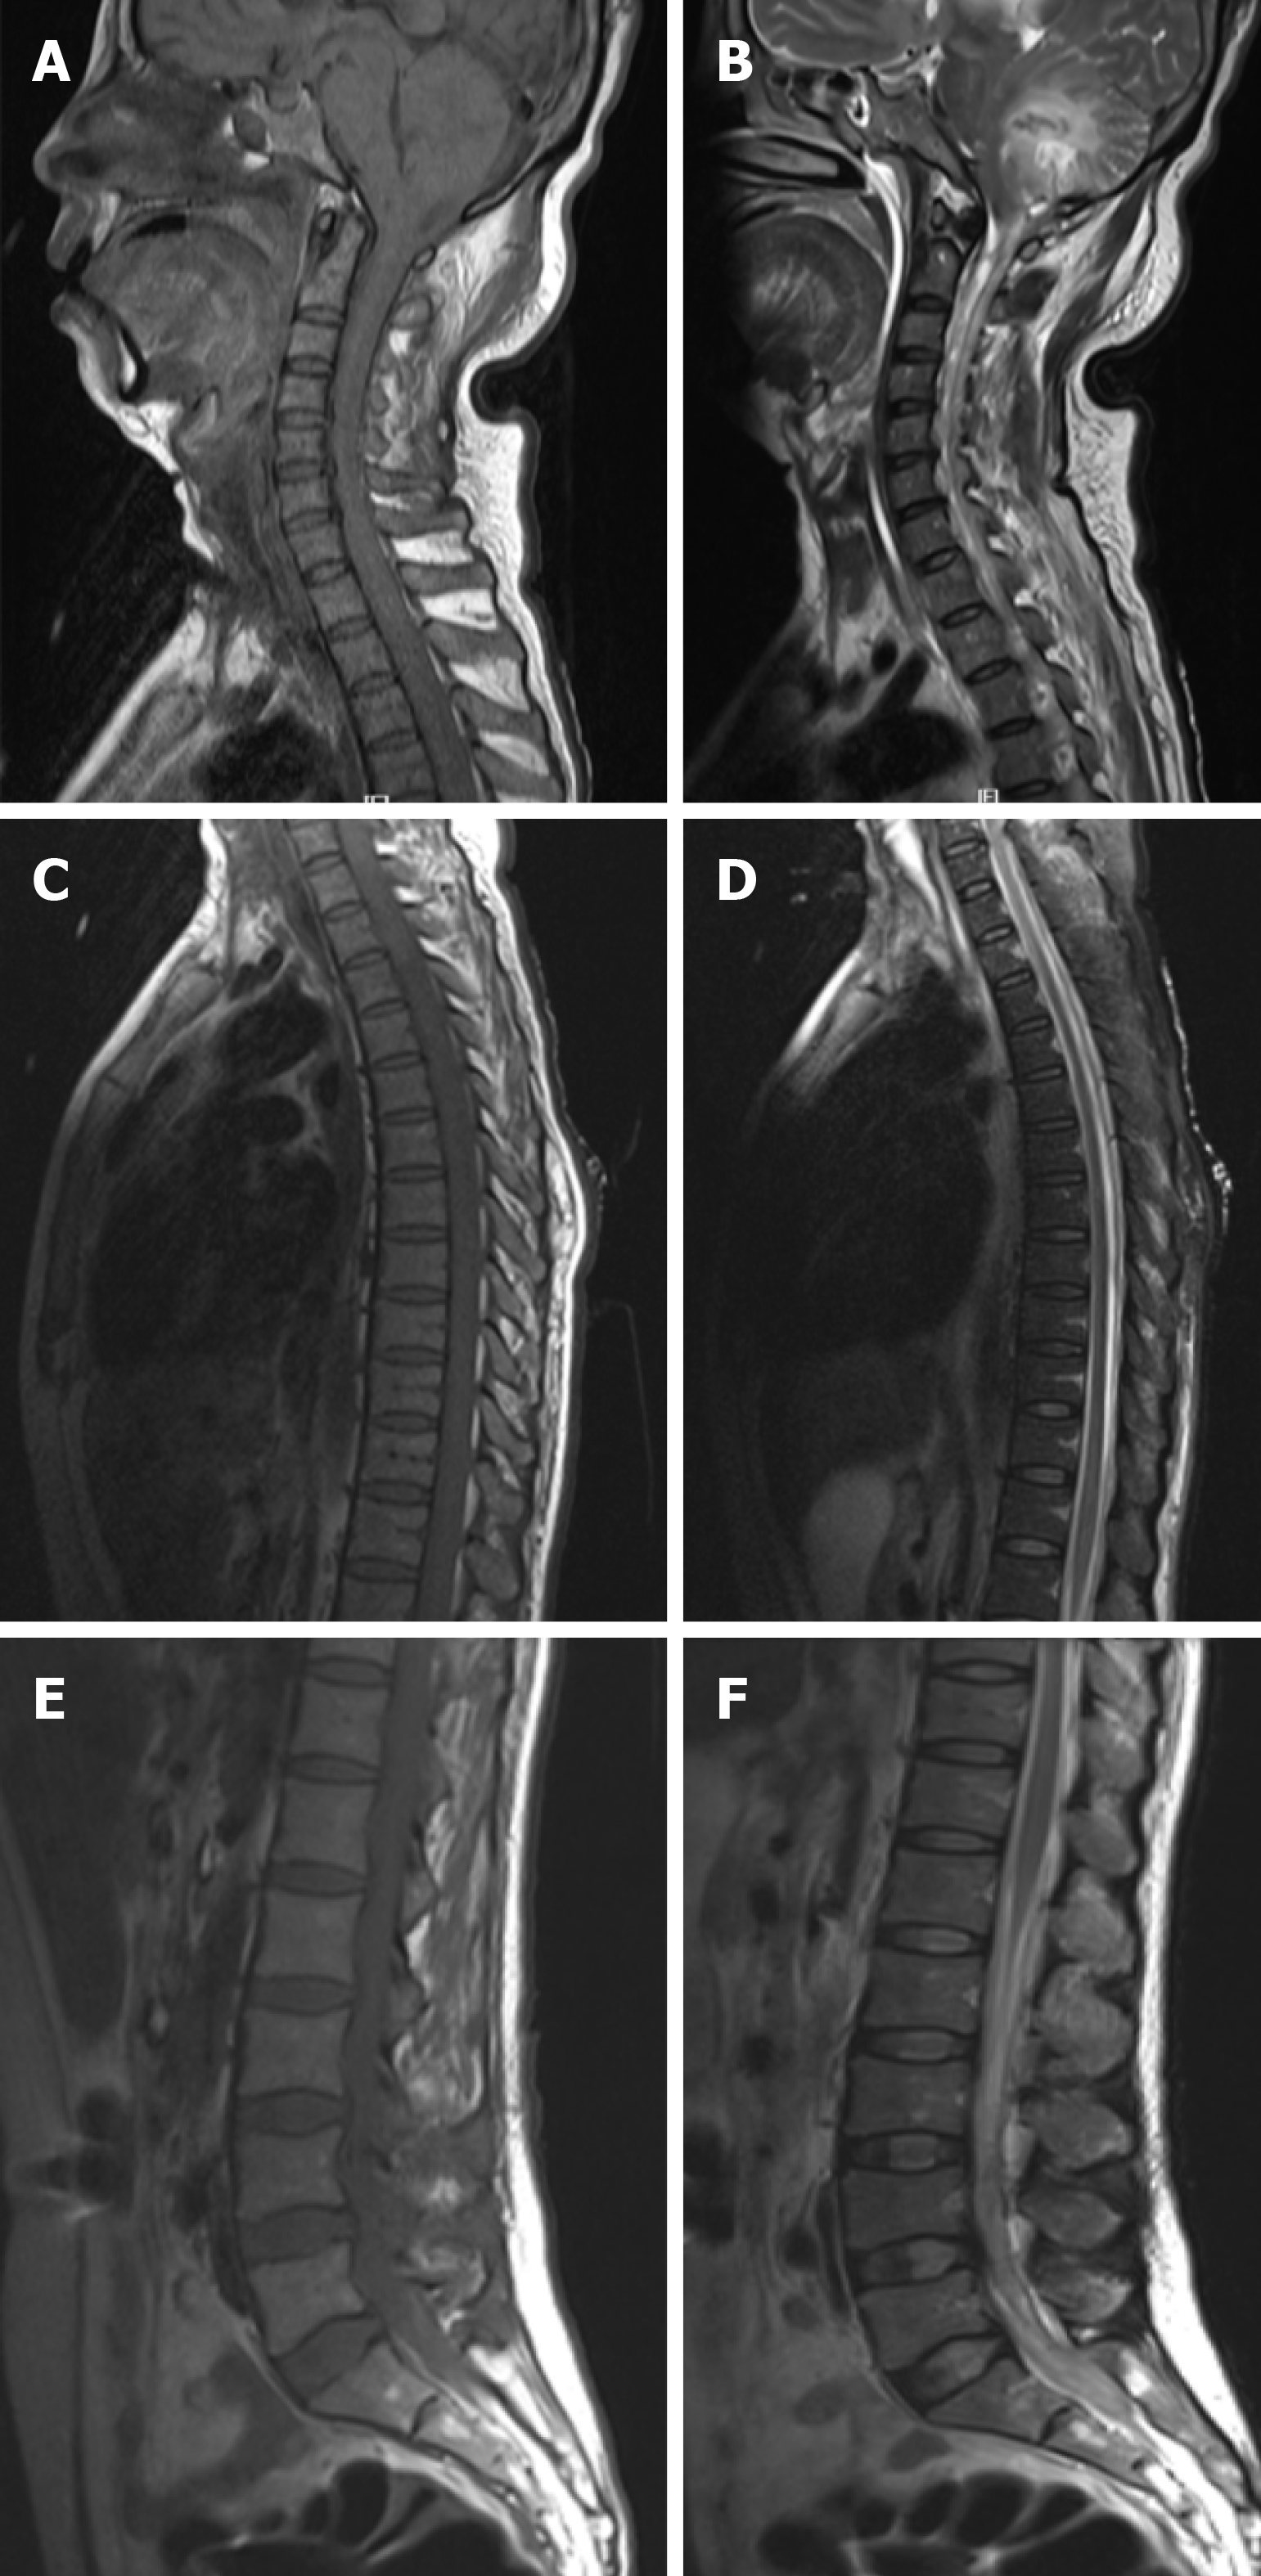
Figure 4 Spinal magnetic resonance imaging on admission.
A and B: Flake-like and stripe-like long T1 and long T2 signals were seen in the cerebellar hemisphere and cervical spinal cords on spinal magnetic resonance imaging (MRI); C and D: Long stripe T1 and T2 abnormal signals were seen in the T1-2 spinal cord on chest MRI; E and F: A flake-like low signal was seen in the spinal cord on lumbar MRI, and multiple nodular low signals were observed in the cauda equine innervation area at the L3-4 levels.
- Citation: Xue H, Wang XH, Shi L, Wei Q, Zhang YM, Yang HF. Dental focal infection-induced ventricular and spinal canal empyema: A case report. World J Clin Cases 2020; 8(14): 3114-3121
- URL: https://www.wjgnet.com/2307-8960/full/v8/i14/3114.htm
- DOI: https://dx.doi.org/10.12998/wjcc.v8.i14.3114


