Copyright
©The Author(s) 2020.
World J Clin Cases. Jun 26, 2020; 8(12): 2574-2584
Published online Jun 26, 2020. doi: 10.12998/wjcc.v8.i12.2574
Published online Jun 26, 2020. doi: 10.12998/wjcc.v8.i12.2574
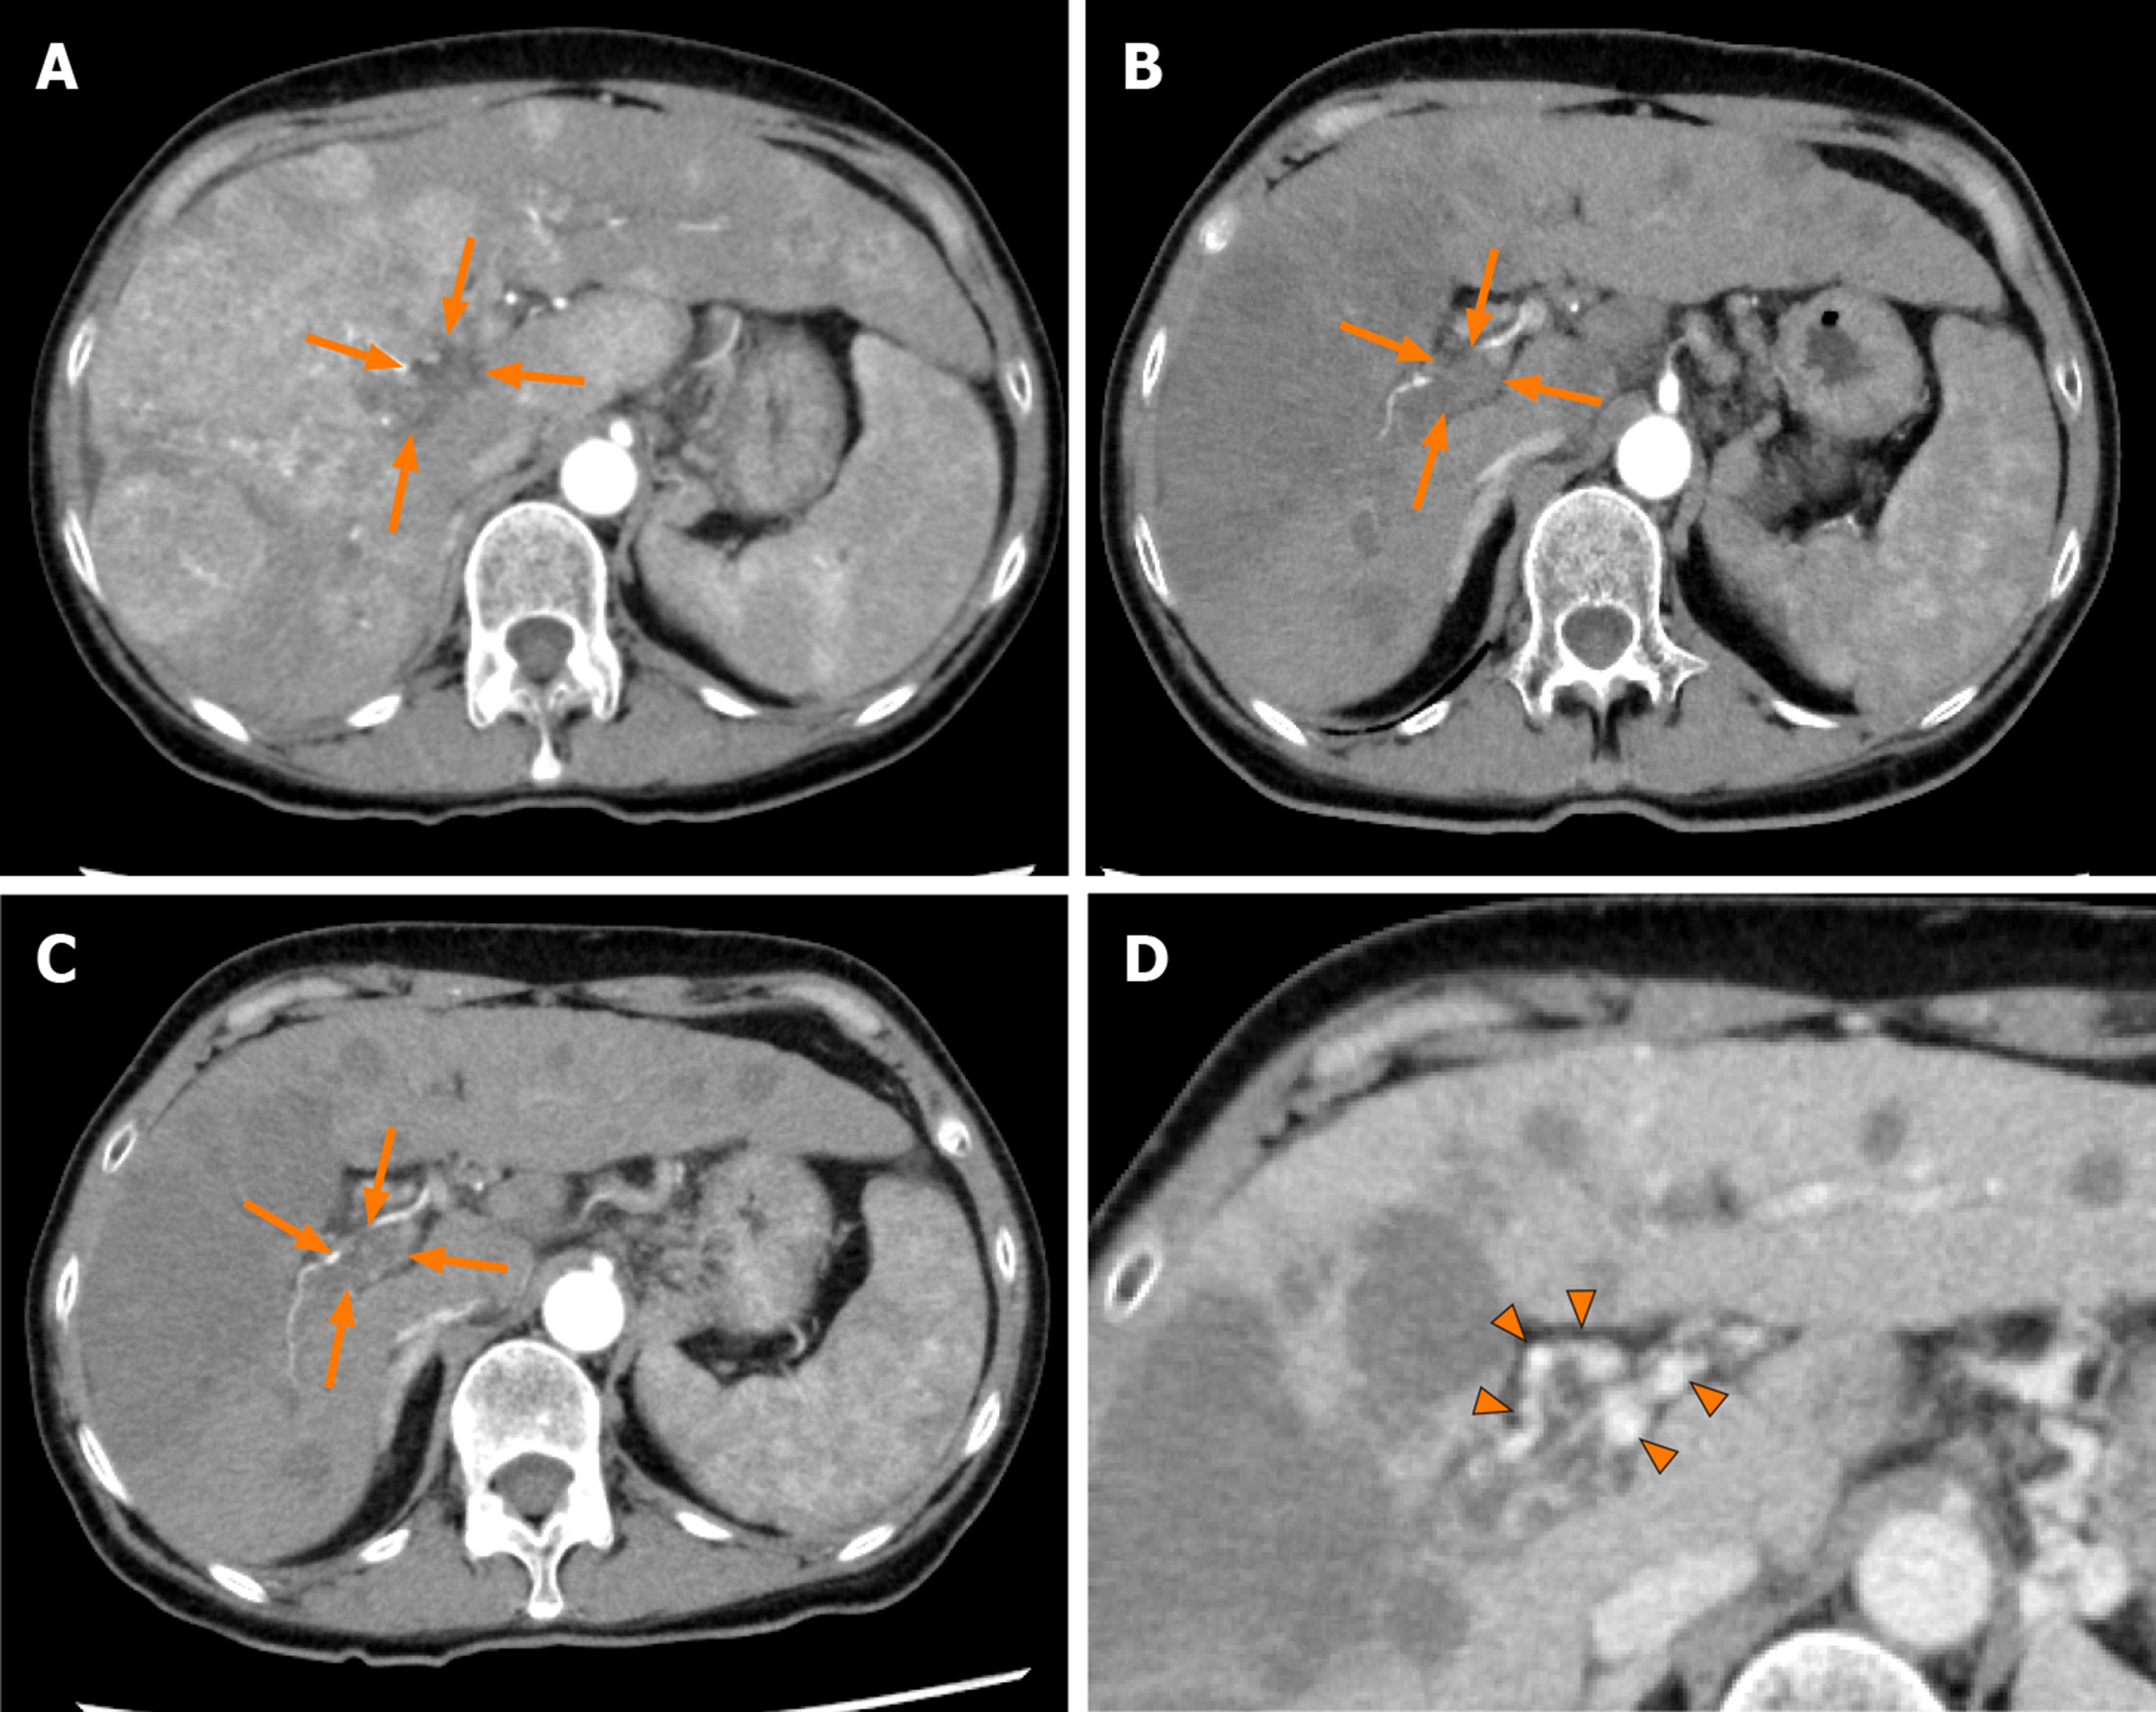
Figure 3 Dynamic contrast-enhanced computed tomography findings of the tumor thrombus in the main portal vein in case 2.
A: Arterial-phase computed tomography (CT) image prior to the start of lenvatinib administration showing marked vascularity of the hepatocellular carcinomas, and a tumor thrombus in the main portal vein (arrows); B: Arterial-phase CT image at 4 wk after the start of lenvatinib administration showing a marked decrease of the vascularity of the hepatocellular carcinomas and decrease of the size of the tumor thrombus in the main portal vein (arrows); C: Arterial-phase CT image at 9 wk after the start of lenvatinib administration showing a continuous decrease of the vascularity of both the hepatocellular carcinomas and the size of the tumor thrombus in the main portal vein (arrows); and D: Portal-phase CT image at 9 wk after the start of lenvatinib administration showing collateral veins around the main portal vein (arrowheads).
- Citation: Komiyama S, Numata K, Moriya S, Fukuda H, Chuma M, Maeda S. Lenvatinib for large hepatocellular carcinomas with portal trunk invasion: Two case reports. World J Clin Cases 2020; 8(12): 2574-2584
- URL: https://www.wjgnet.com/2307-8960/full/v8/i12/2574.htm
- DOI: https://dx.doi.org/10.12998/wjcc.v8.i12.2574


