Copyright
©The Author(s) 2020.
World J Clin Cases. Jun 26, 2020; 8(12): 2574-2584
Published online Jun 26, 2020. doi: 10.12998/wjcc.v8.i12.2574
Published online Jun 26, 2020. doi: 10.12998/wjcc.v8.i12.2574
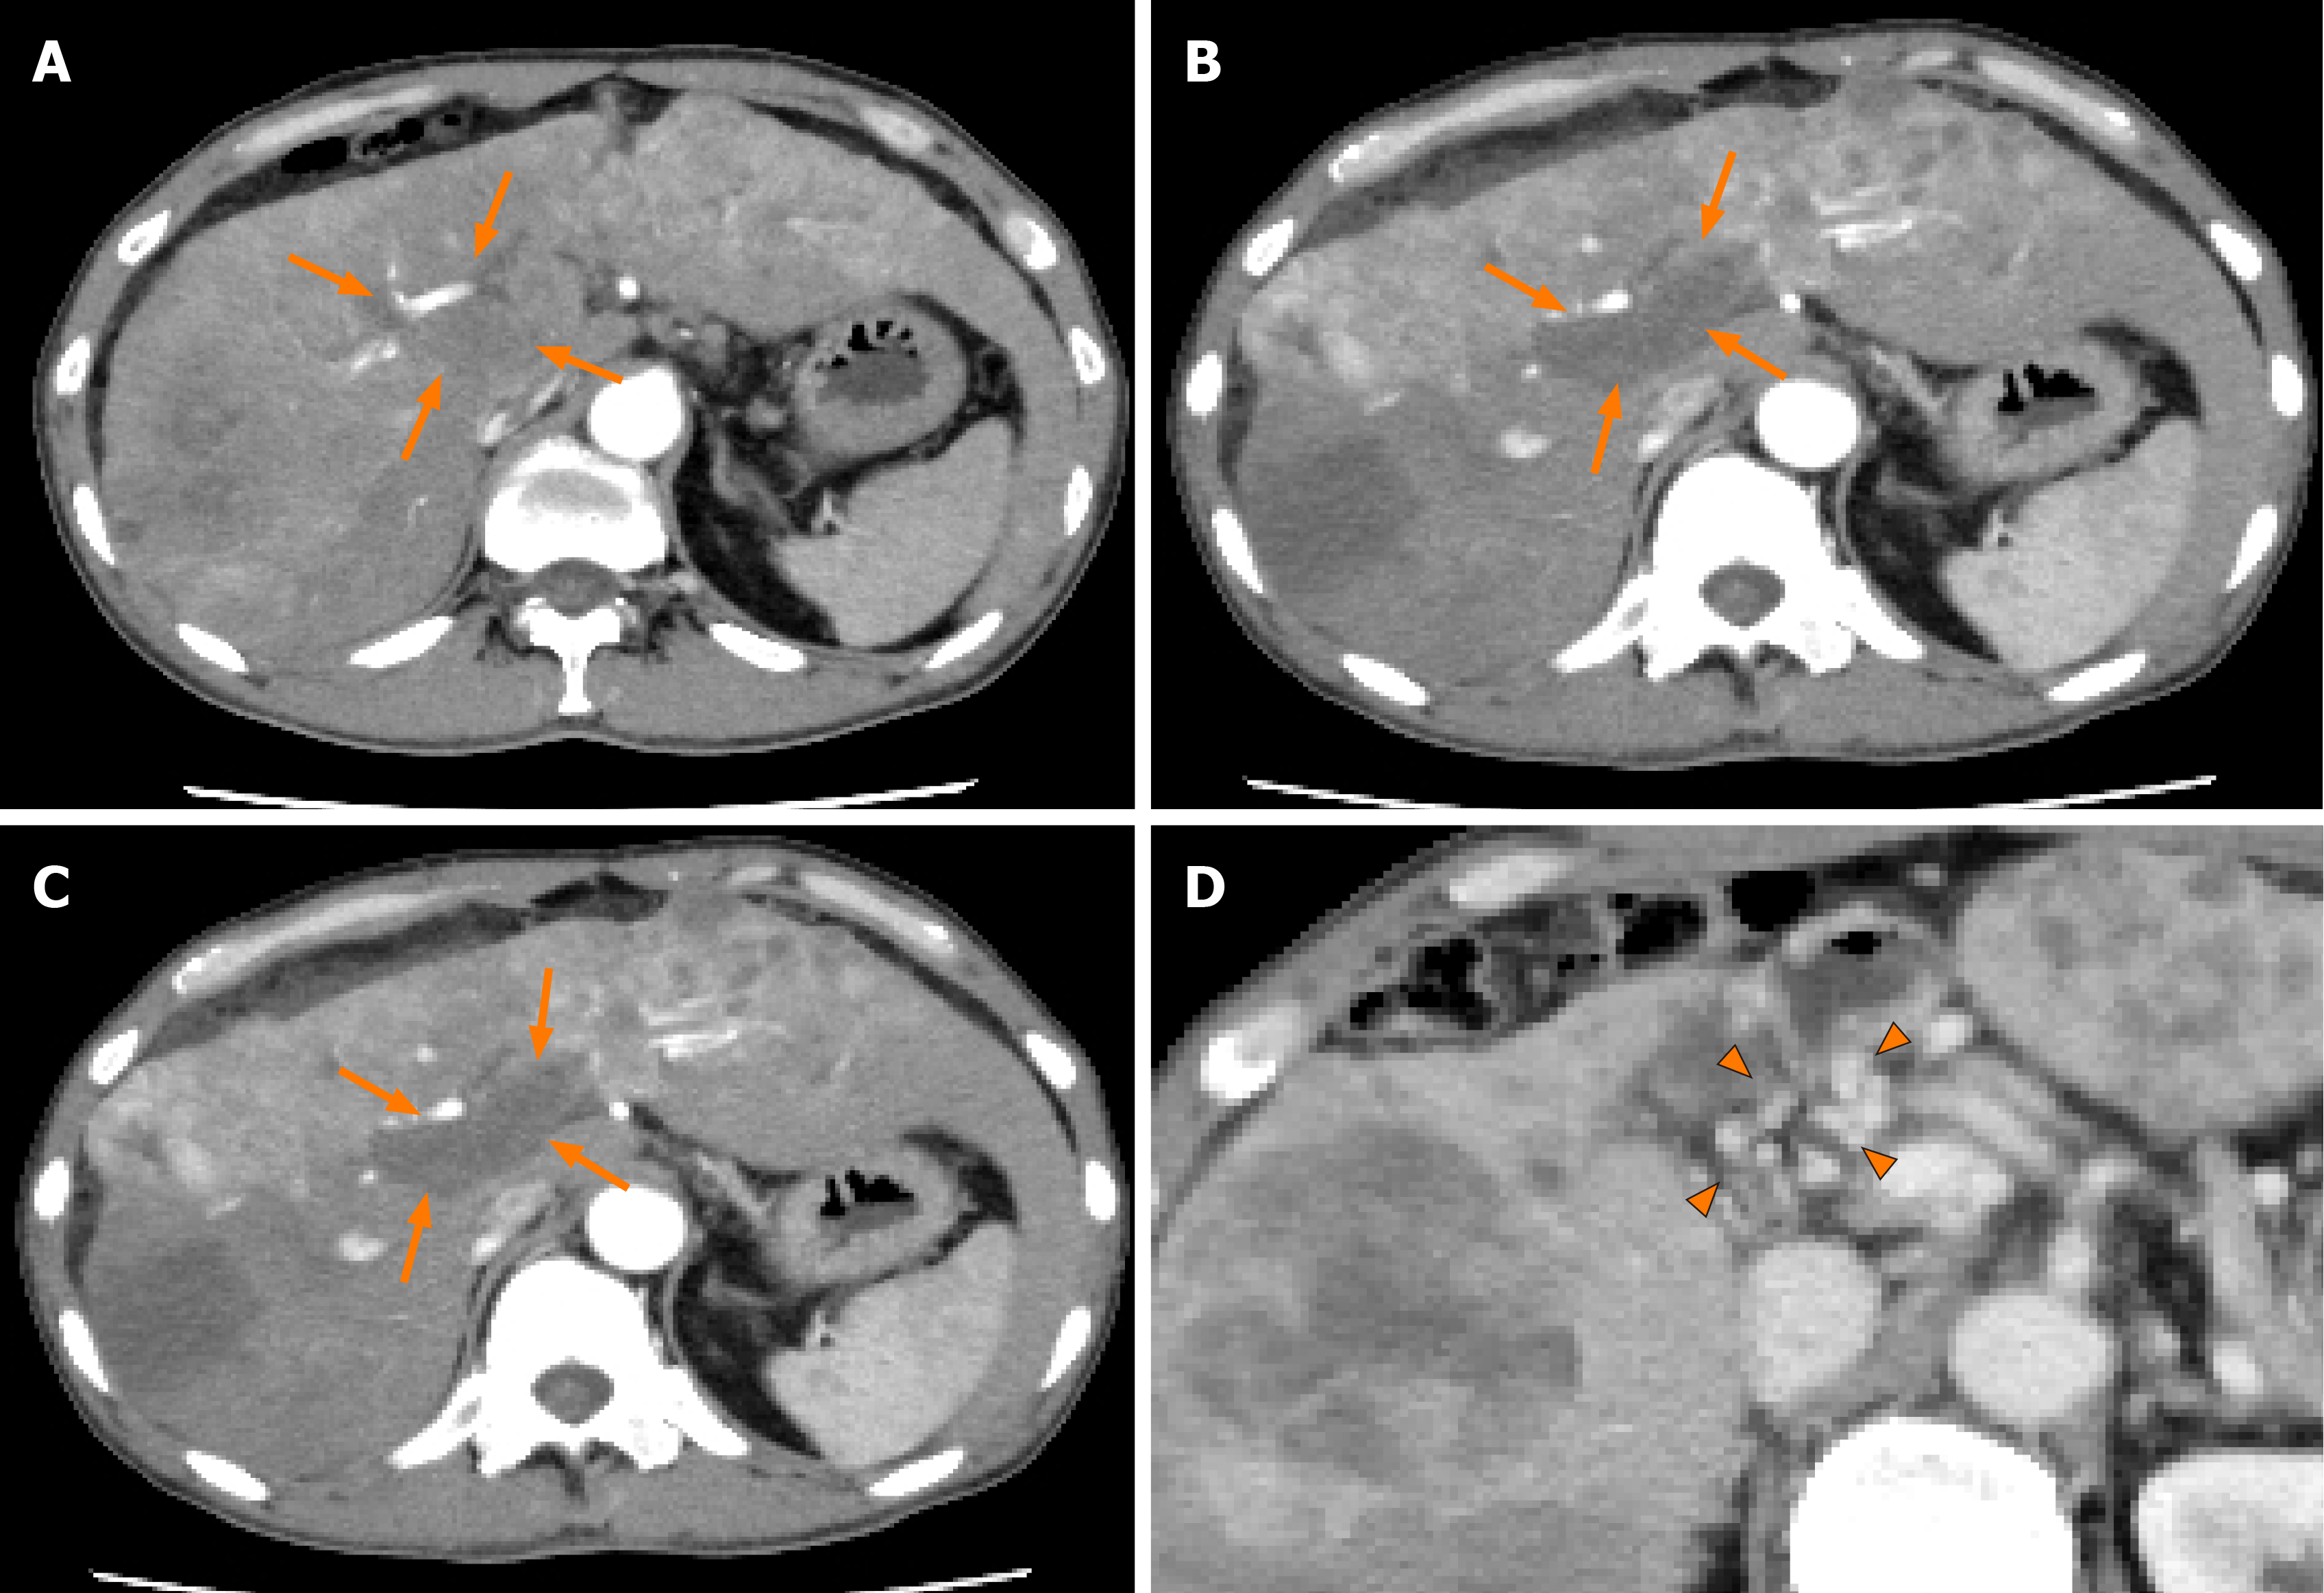
Figure 1 Dynamic contrast-enhanced computed tomography findings of the tumor thrombus in the main portal vein in case 1.
A: Arterial-phase computed tomography (CT) image prior to the start of lenvatinib administration showing marked vascularity of the hepatocellular carcinomas (HCCs), and a tumor thrombus in the main portal vein (arrows); B: Arterial-phase CT image at 2 wk after the start of lenvatinib administration showing a marked decrease of the vascularity of both the HCCs and the tumor thrombus in the main portal vein (arrows); C: Arterial-phase CT image at 8 wk after the start of lenvatinib administration showing a continuous decrease of the vascularity of both the HCCs and the tumor thrombus in the main portal vein, and decrease of the size of the tumor thrombus in the main portal vein (arrows); and D: Portal-phase CT image at 14 wk after the start of lenvatinib administration showing collateral veins around the main portal vein (arrowheads).
- Citation: Komiyama S, Numata K, Moriya S, Fukuda H, Chuma M, Maeda S. Lenvatinib for large hepatocellular carcinomas with portal trunk invasion: Two case reports. World J Clin Cases 2020; 8(12): 2574-2584
- URL: https://www.wjgnet.com/2307-8960/full/v8/i12/2574.htm
- DOI: https://dx.doi.org/10.12998/wjcc.v8.i12.2574


