Copyright
©The Author(s) 2020.
World J Clin Cases. Jun 26, 2020; 8(12): 2510-2519
Published online Jun 26, 2020. doi: 10.12998/wjcc.v8.i12.2510
Published online Jun 26, 2020. doi: 10.12998/wjcc.v8.i12.2510
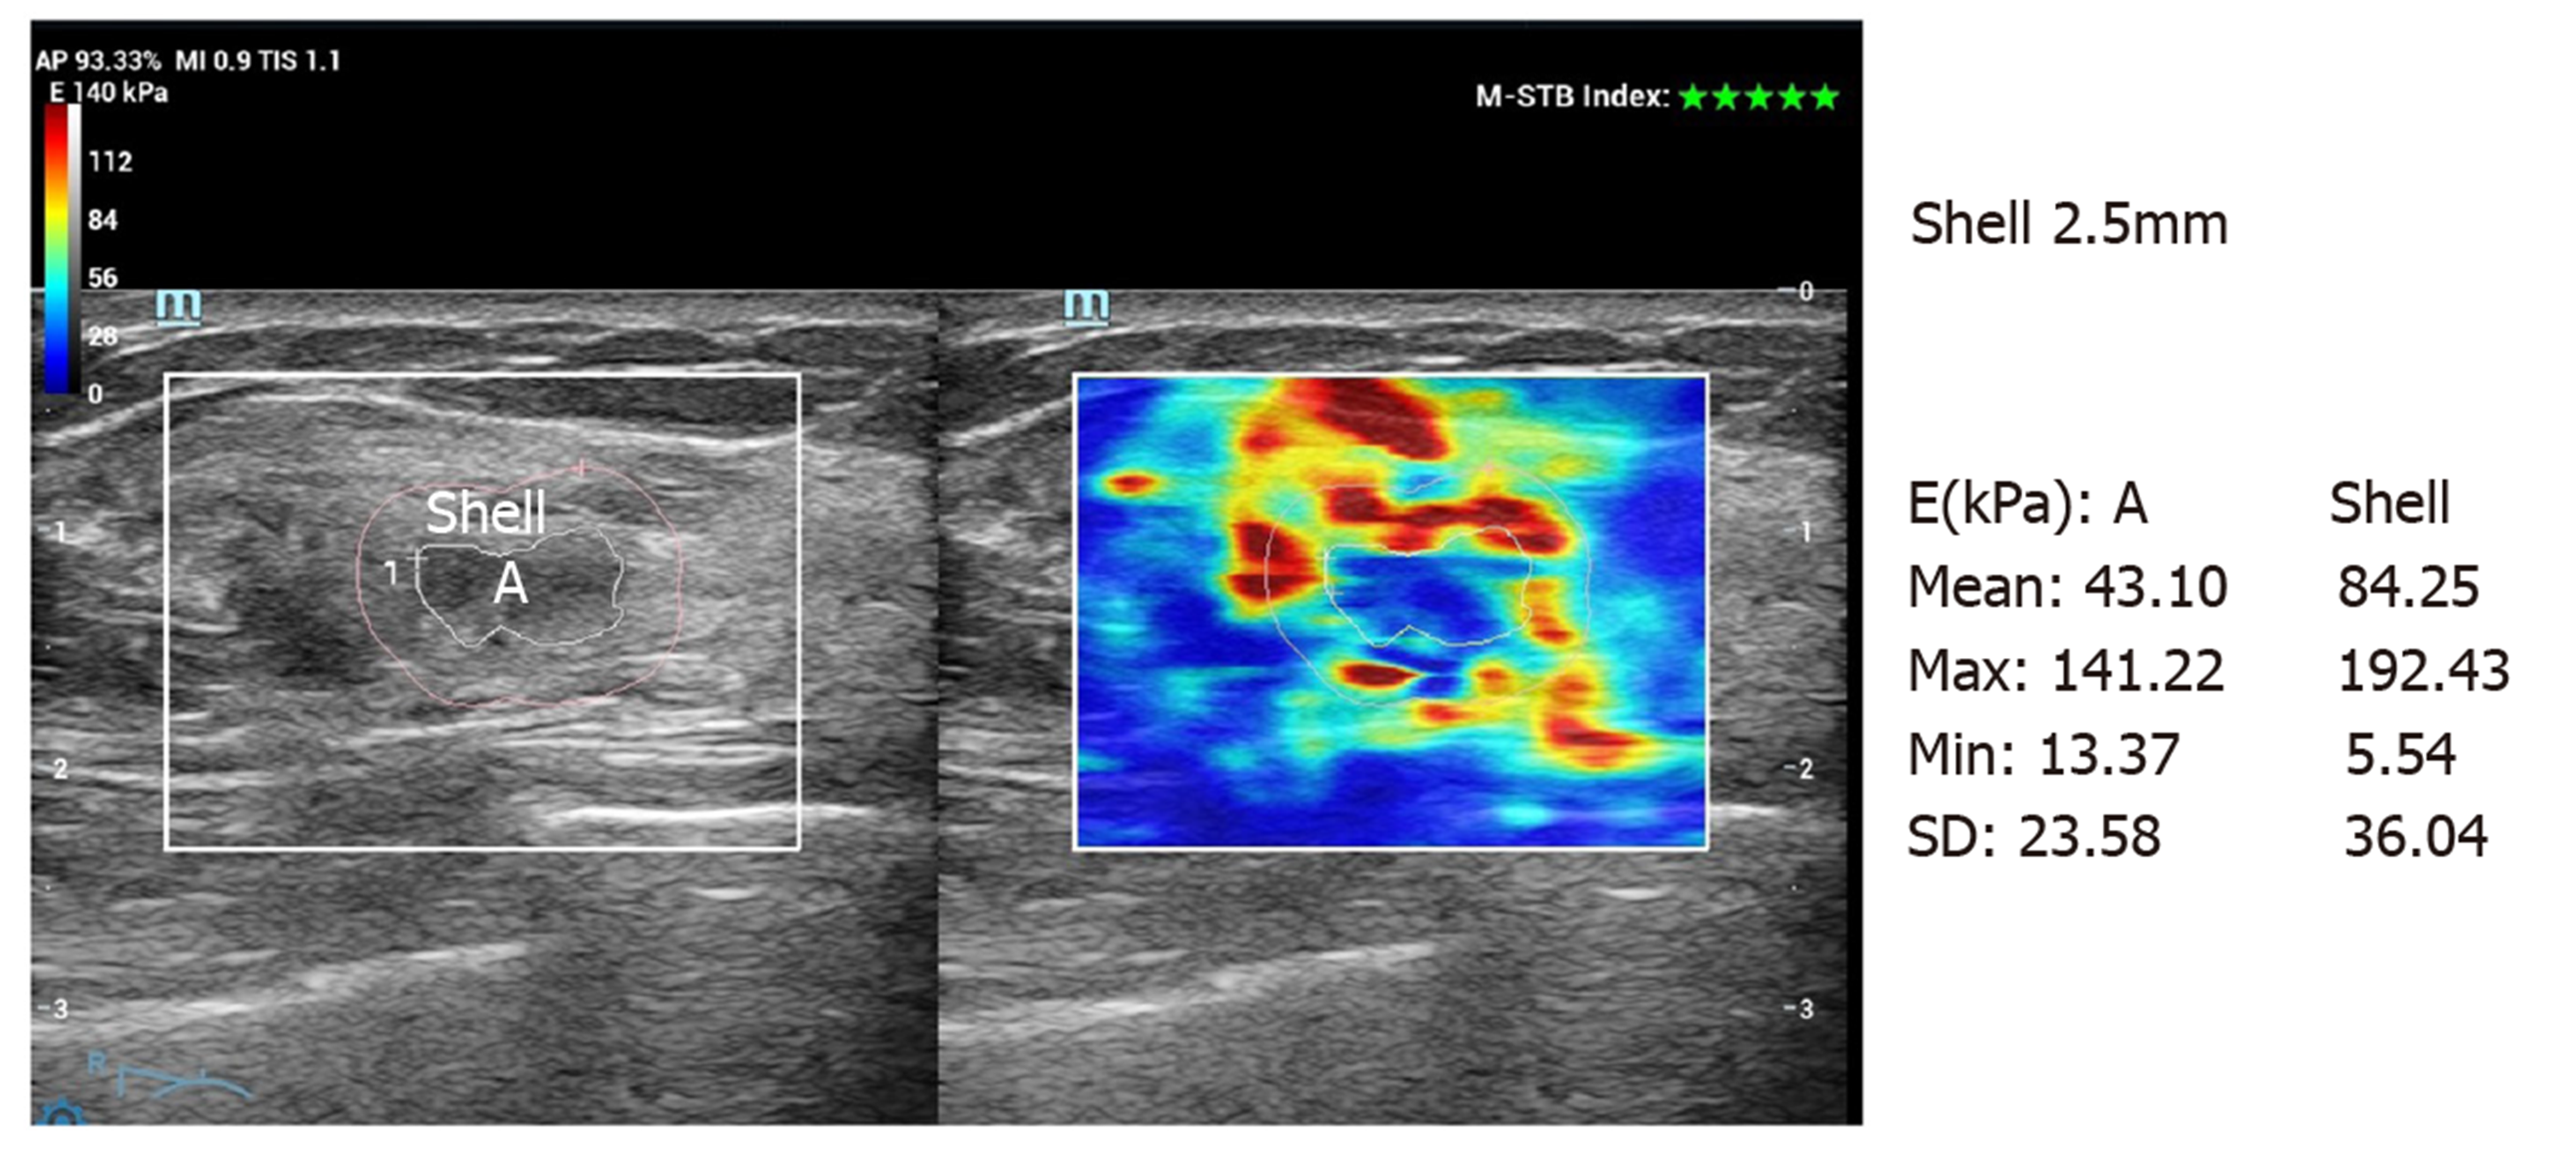
Figure 2 Gray-scale-velocity dual pattern.
The traced line of the outer edge (white circle) of the NMLs and the shell at 2.5 mm (pink circle) can be seen on the left image. A “stiff rim” of red and orange can also be seen on the right image. Mean, maximum, and minimum elastic values and the standard deviation were 33.80 kPa, 92.869 kPa, 6.23 kPa and 14.41 kPa, respectively, for internal elasticity, and 81.15 kPa, 167.97 kPa, 5.03 kPa and 28.05 kPa, respectively, for the shell at 2.5 mm. The pathology result was infiltrating ductal carcinoma. A: The area within the lesion. Shell: The area around the lesion. Emax: Maximum; Emean: Mean; Min: Minimum; Esd: Elastic values and the standard deviation.
- Citation: Xu P, Wu M, Yang M, Xiao J, Ruan ZM, Wu LY. Evaluation of internal and shell stiffness in the differential diagnosis of breast non-mass lesions by shear wave elastography. World J Clin Cases 2020; 8(12): 2510-2519
- URL: https://www.wjgnet.com/2307-8960/full/v8/i12/2510.htm
- DOI: https://dx.doi.org/10.12998/wjcc.v8.i12.2510


