Copyright
©The Author(s) 2020.
World J Clin Cases. Jun 6, 2020; 8(11): 2246-2254
Published online Jun 6, 2020. doi: 10.12998/wjcc.v8.i11.2246
Published online Jun 6, 2020. doi: 10.12998/wjcc.v8.i11.2246
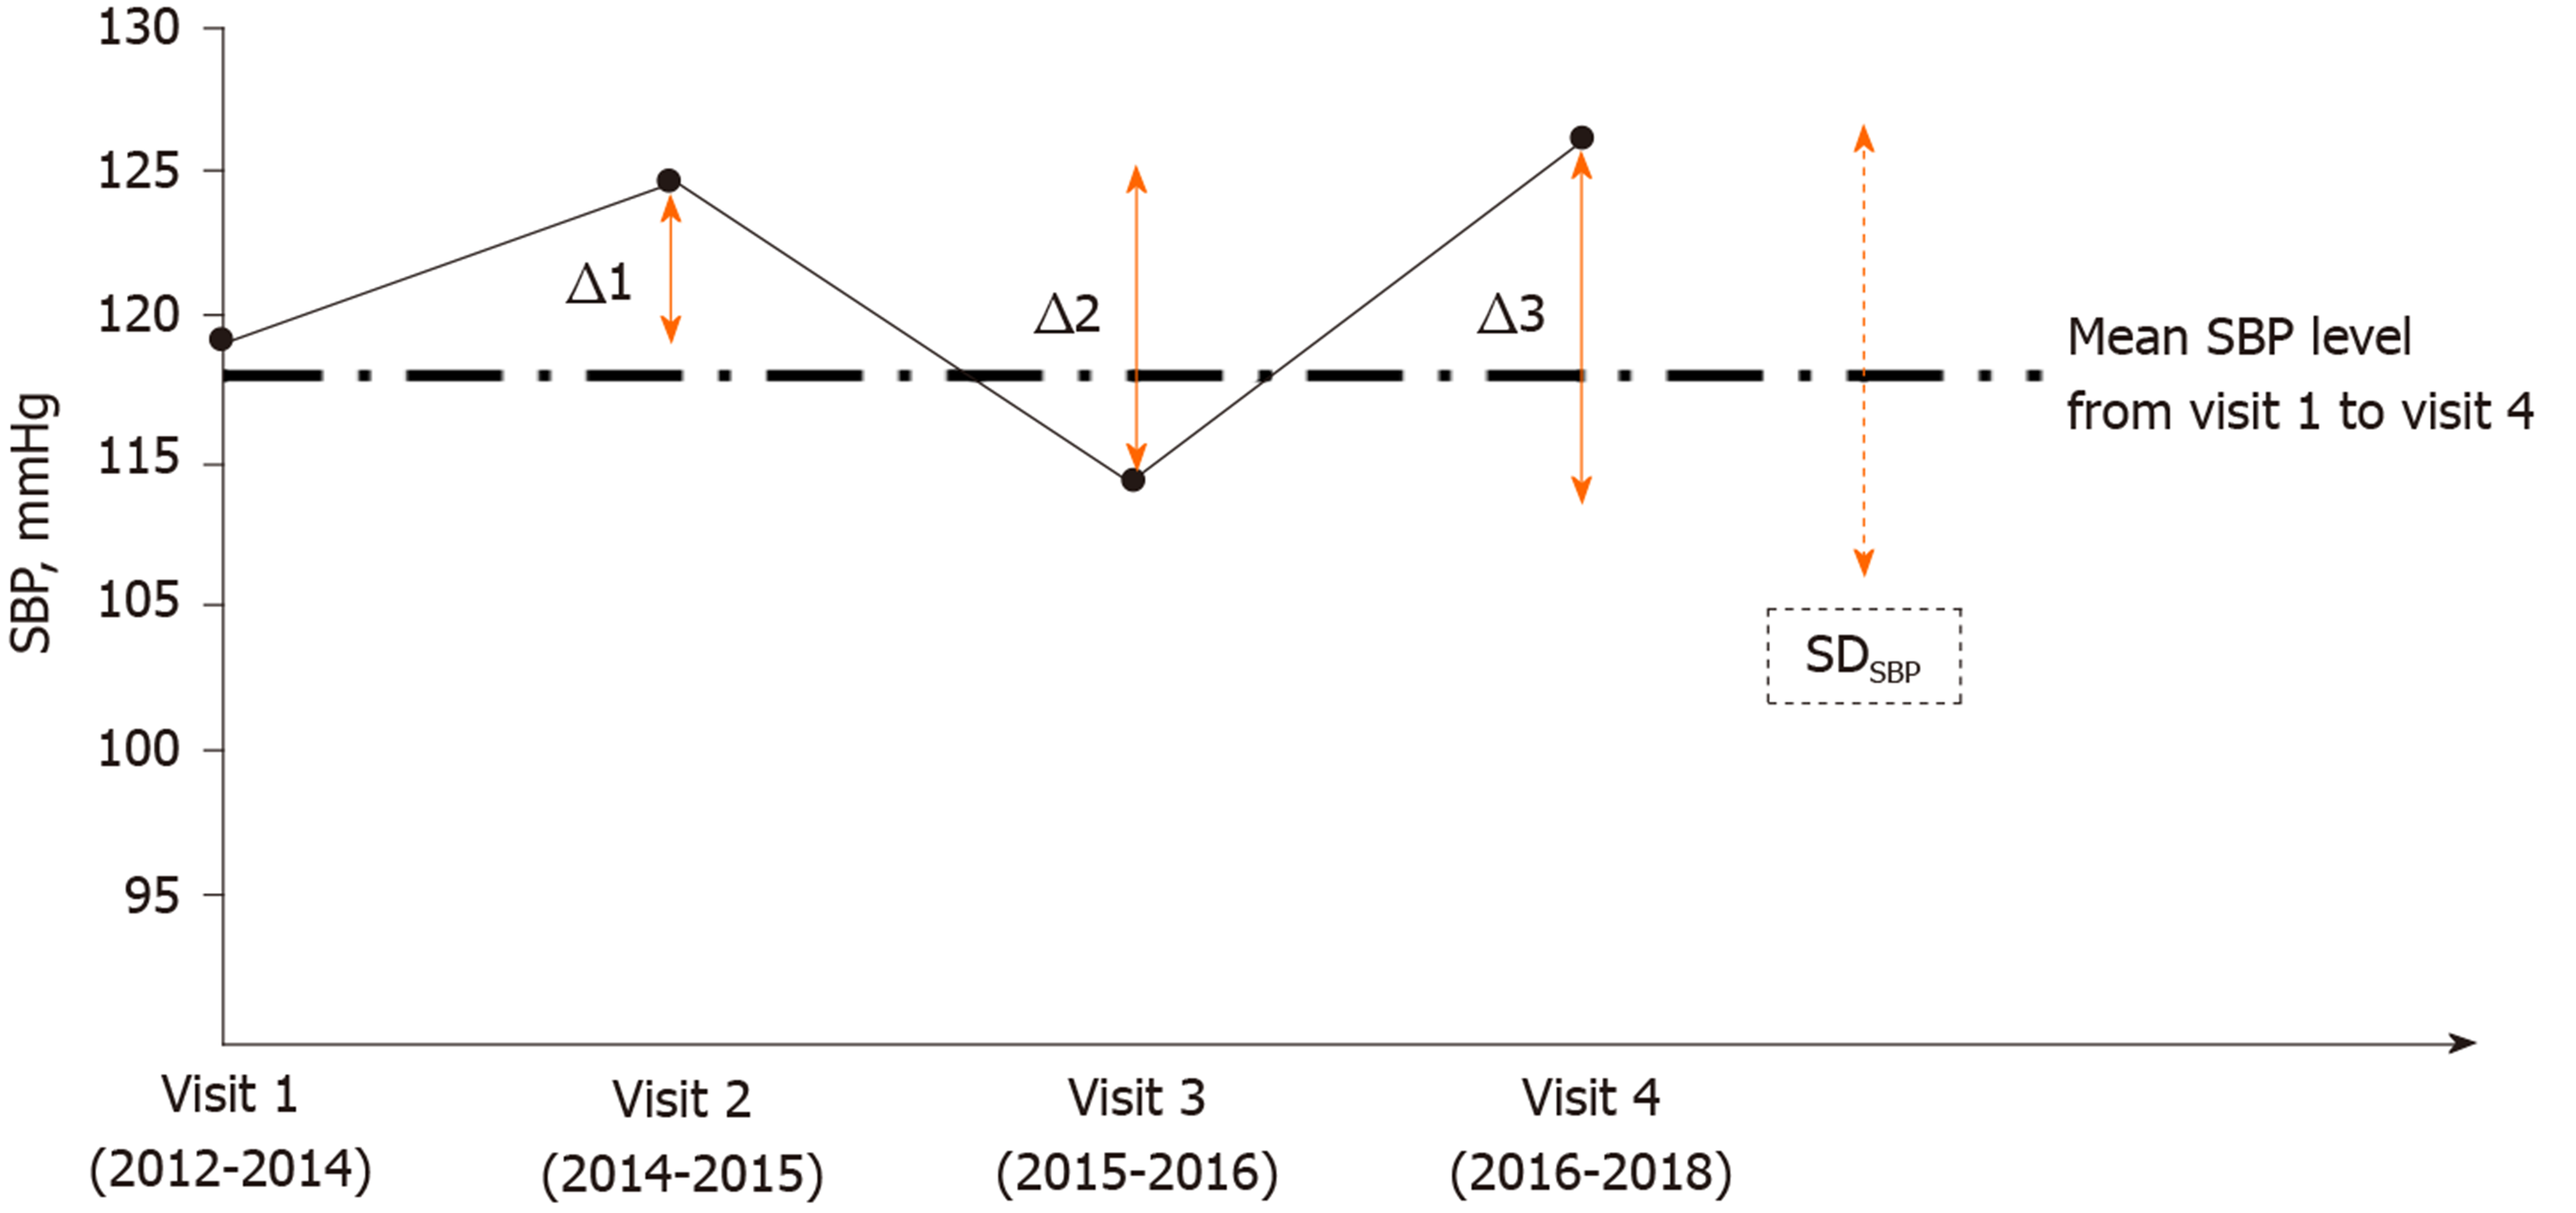
Figure 1 Long-term blood pressure variability was assessed by standard deviation and average real variability across 4 visits in the study period (2012-2018).
(Standard deviation)SBP and [average real variability (ARV)]SBP were illustrated by dotted and solid lines, respectively. ARVSBP is calculated as an average of absolute differences between successive systolic blood pressure measurements, taking the order of measurements into account: (|Δ1| +|Δ2| +|Δ3|)/3). SD: Standard deviation; SBP: Systolic blood pressure.
- Citation: Lin YK, Liu PY, Fan CH, Tsai KZ, Lin YP, Lee JM, Lee JT, Lin GM. Metabolic biomarkers and long-term blood pressure variability in military young male adults. World J Clin Cases 2020; 8(11): 2246-2254
- URL: https://www.wjgnet.com/2307-8960/full/v8/i11/2246.htm
- DOI: https://dx.doi.org/10.12998/wjcc.v8.i11.2246


