Copyright
©The Author(s) 2020.
World J Clin Cases. Jun 6, 2020; 8(11): 2127-2136
Published online Jun 6, 2020. doi: 10.12998/wjcc.v8.i11.2127
Published online Jun 6, 2020. doi: 10.12998/wjcc.v8.i11.2127
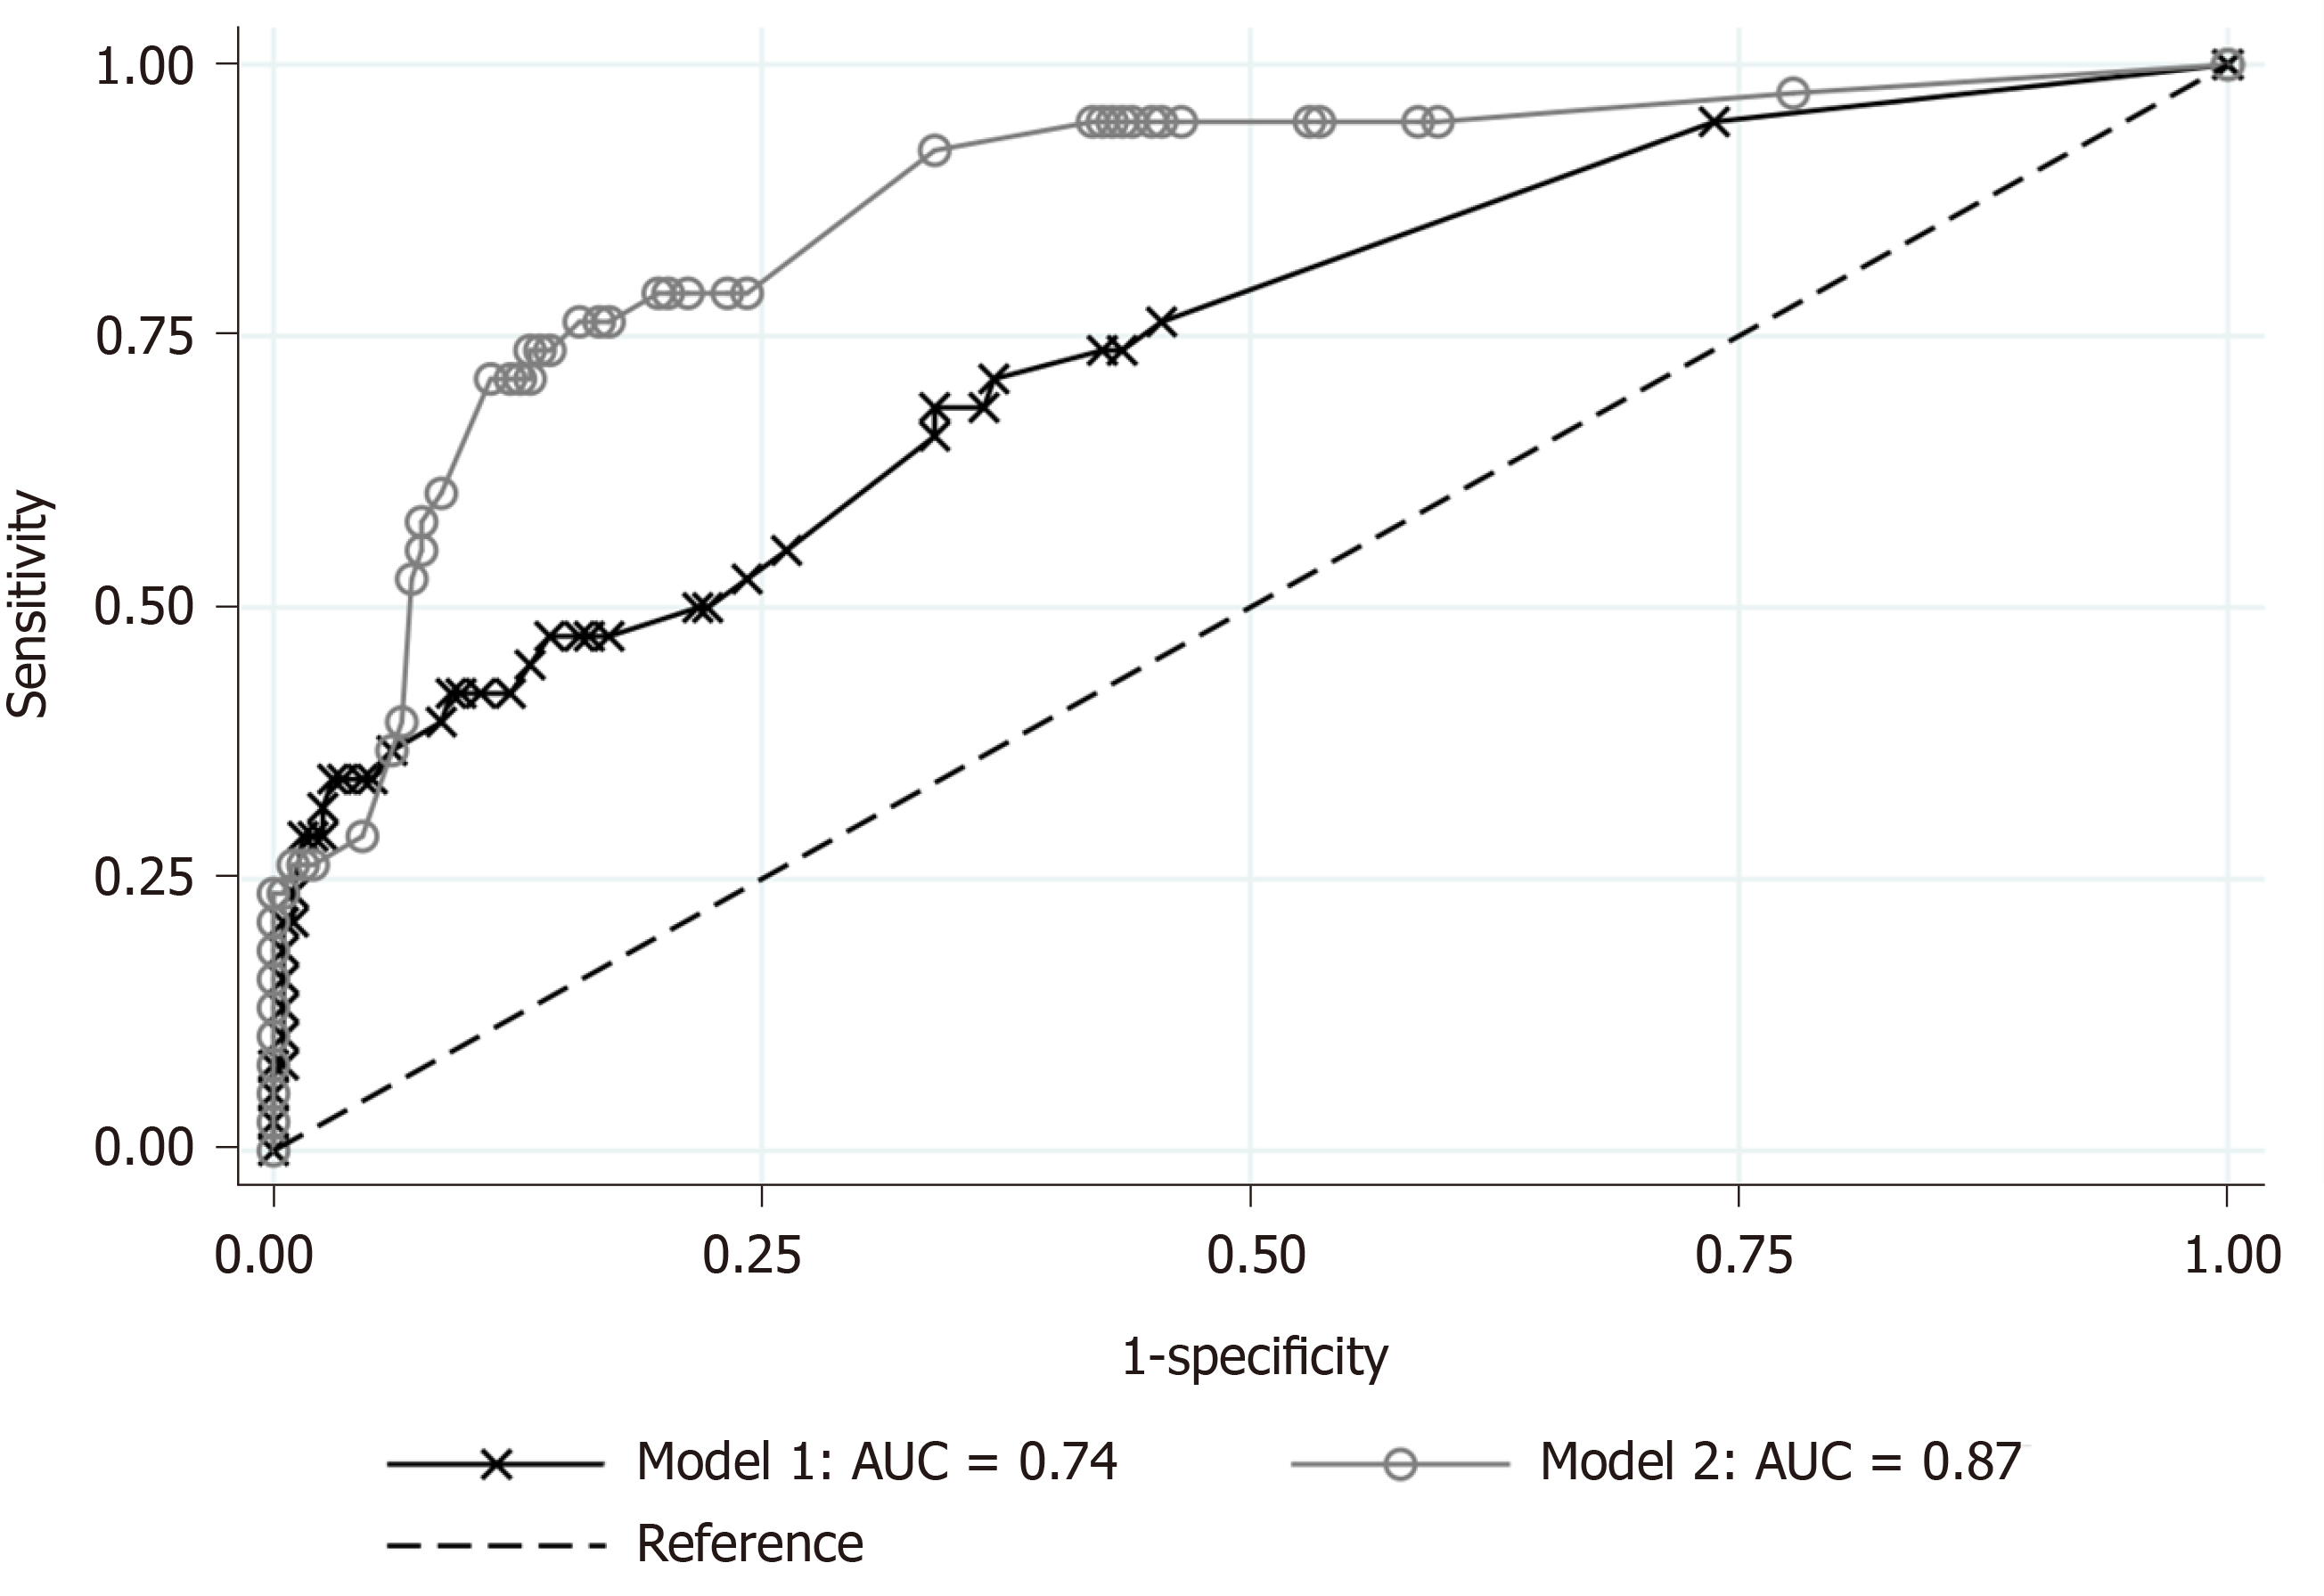
Figure 2 Comparison of the regression models for prediction of complicated appendicitis.
The receiver operating characteristic curves are shown for Model 1 (explanatory variables: Age > 65 years old, onset-to-visit interval, anorexia, tachycardia, and fever) and Model 2 (explanatory variables: Age > 65 years old, onset-to-visit interval, anorexia, serum C-reactive protein level, renal dysfunction, and hyponatremia). Area under the curve of the receiver operating characteristic curve for Model 2 is superior to that of Model 1 (0.87 vs 0.74).
- Citation: Sasaki Y, Komatsu F, Kashima N, Suzuki T, Takemoto I, Kijima S, Maeda T, Miyazaki T, Honda Y, Zai H, Shimada N, Funahashi K, Urita Y. Clinical prediction of complicated appendicitis: A case-control study utilizing logistic regression. World J Clin Cases 2020; 8(11): 2127-2136
- URL: https://www.wjgnet.com/2307-8960/full/v8/i11/2127.htm
- DOI: https://dx.doi.org/10.12998/wjcc.v8.i11.2127


