Copyright
©The Author(s) 2019.
World J Clin Cases. Feb 6, 2019; 7(3): 373-381
Published online Feb 6, 2019. doi: 10.12998/wjcc.v7.i3.373
Published online Feb 6, 2019. doi: 10.12998/wjcc.v7.i3.373
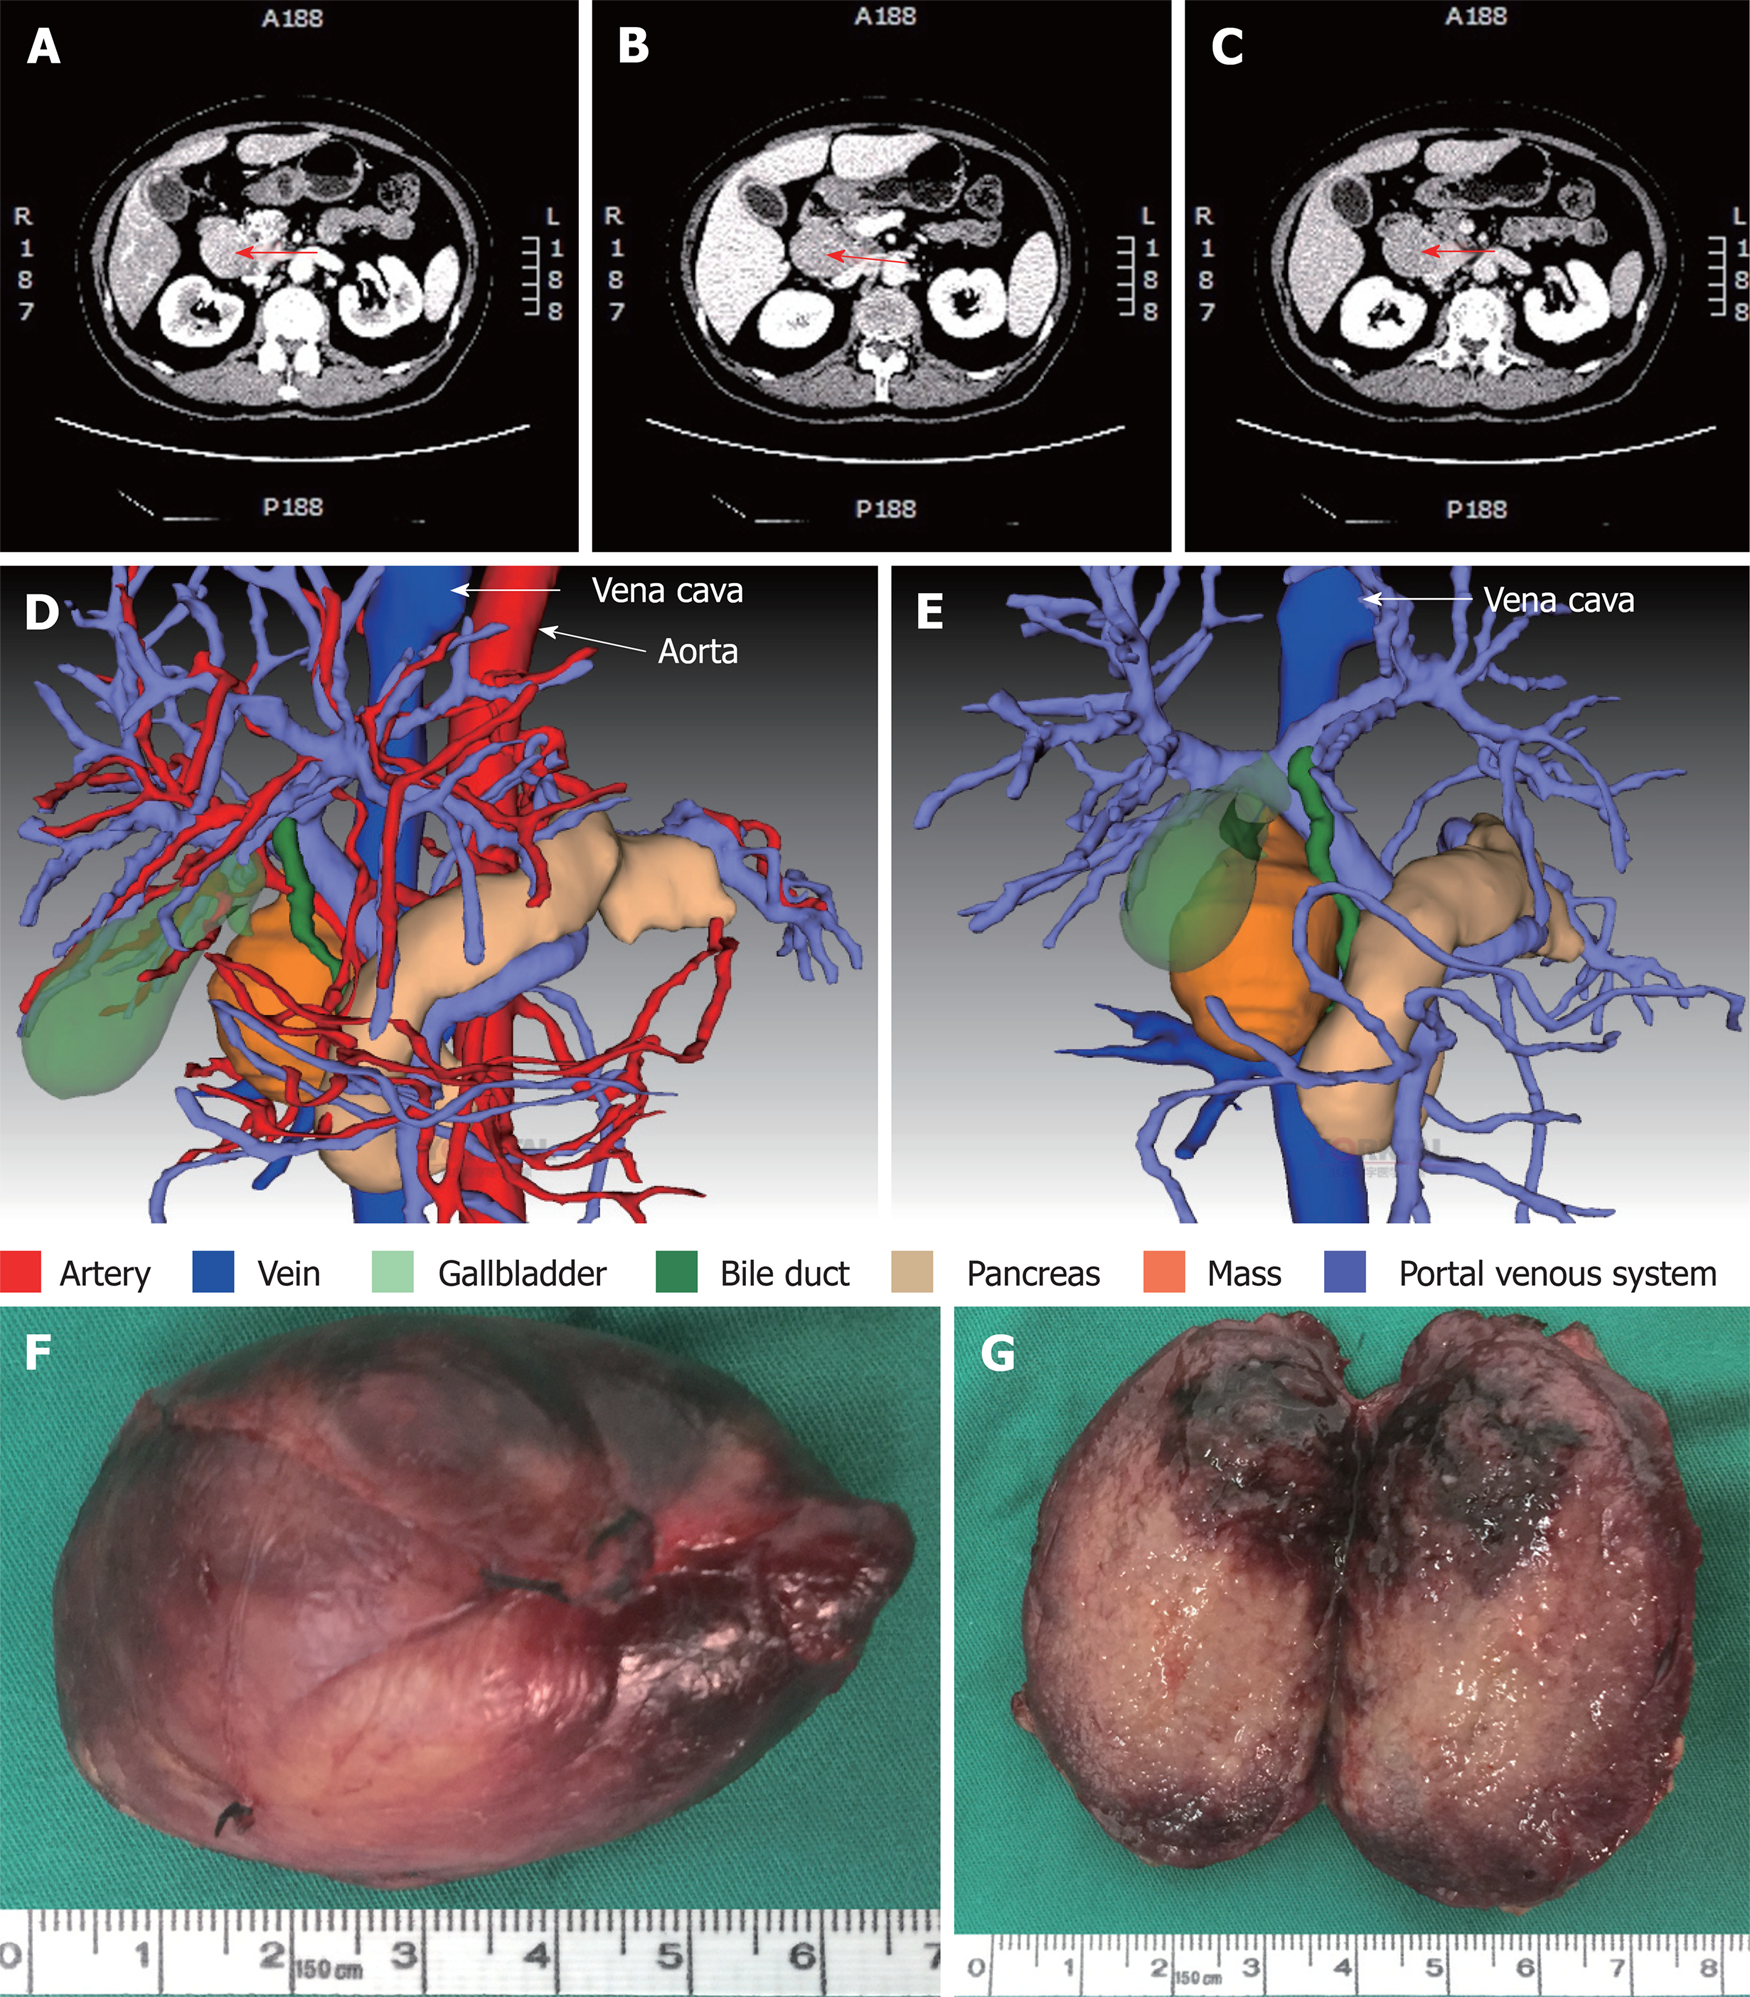
Figure 3 Computed tomography scan, three-dimensional visualization model and the mass.
A-C: Representative images are from enhanced multi-phase abdominal computed tomography scans at the arterial (A), portal venous (B) and equilibrium (C) phases. Arrows point to the mass. D and E: Three-dimensional images were generated to show the adjacent relationship between the mass and adjacent organs and tissues. F: The excised mass. G: The cutting surface.
- Citation: Zhai B, Ren HY, Li WD, Reddy S, Zhang SJ, Sun XY. Castleman disease presenting with jaundice: A case report and review of literature. World J Clin Cases 2019; 7(3): 373-381
- URL: https://www.wjgnet.com/2307-8960/full/v7/i3/373.htm
- DOI: https://dx.doi.org/10.12998/wjcc.v7.i3.373


