Copyright
©The Author(s) 2019.
World J Clin Cases. Nov 6, 2019; 7(21): 3463-3473
Published online Nov 6, 2019. doi: 10.12998/wjcc.v7.i21.3463
Published online Nov 6, 2019. doi: 10.12998/wjcc.v7.i21.3463
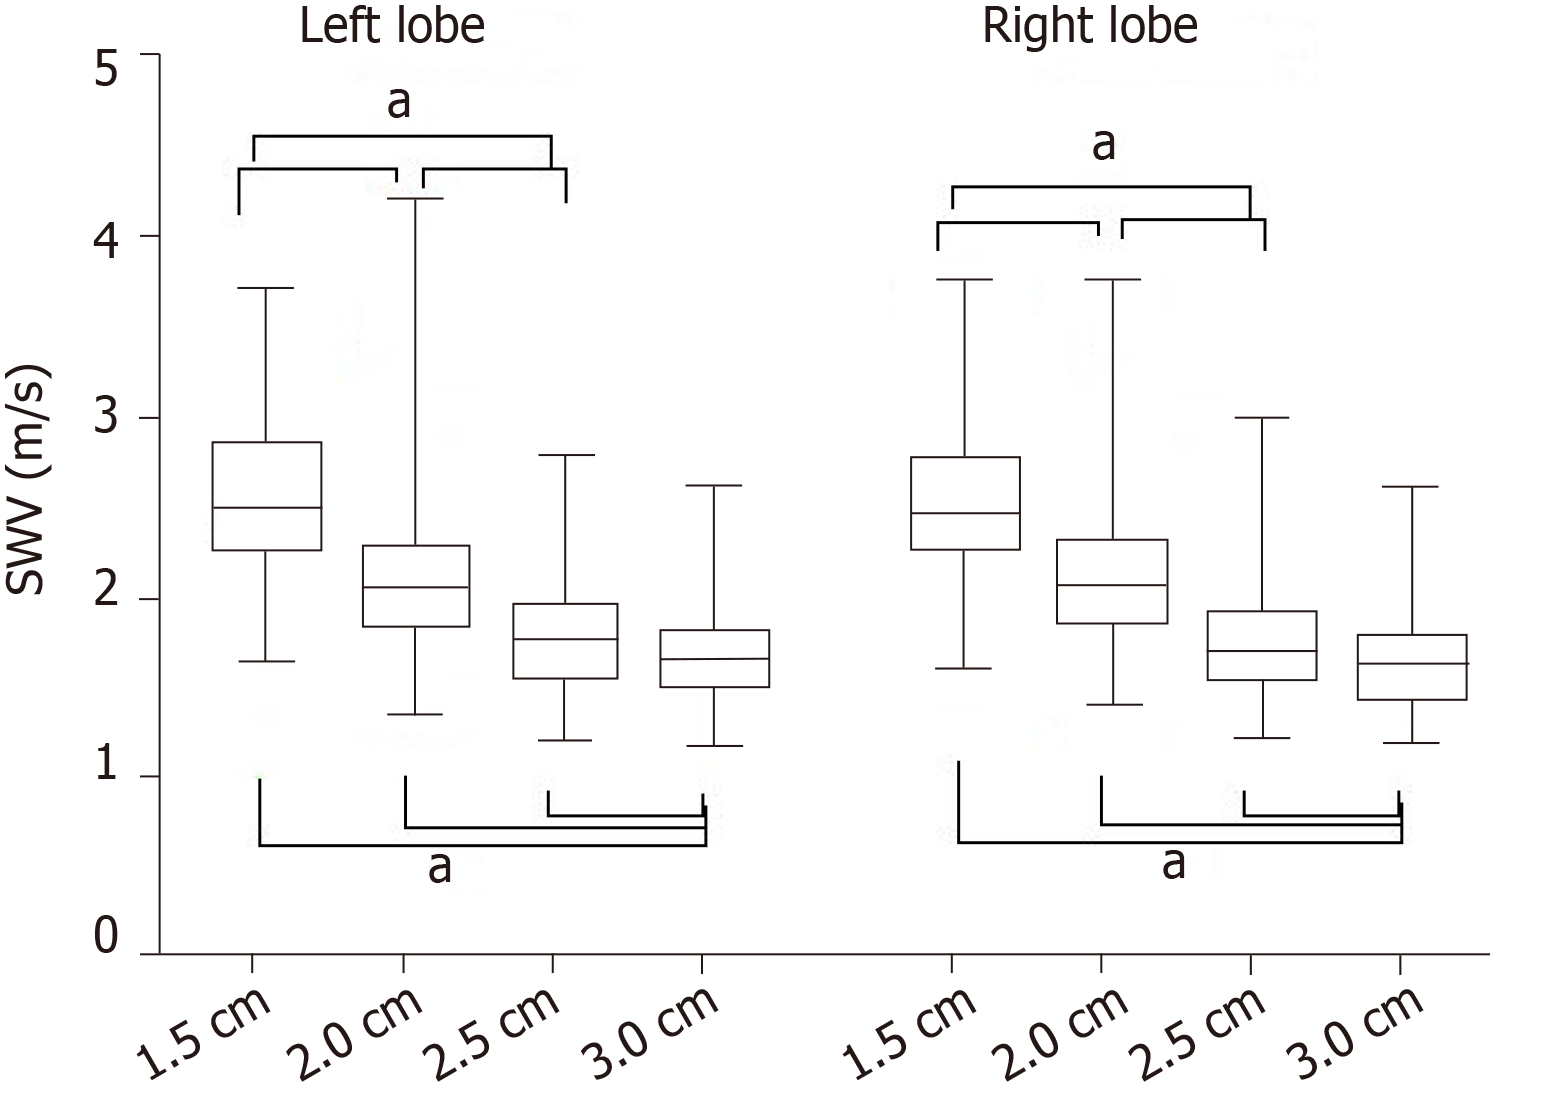
Figure 3 Box-and-whisker plot of the shear wave velocity value of the virtual touch imaging quantification measurement in each liver lobe at different measurement depths.
Significant differences were found between any two measurement depths. Statistically significant by the Kruskal-Wallis test with Bonferroni’s adjustment. aP < 0.05.
- Citation: Sun PX, Tong YY, Shi J, Zhang H, Liu SJ, Du J. Normal values of shear wave velocity in liver tissue of healthy children measured using the latest acoustic radiation force impulse technology. World J Clin Cases 2019; 7(21): 3463-3473
- URL: https://www.wjgnet.com/2307-8960/full/v7/i21/3463.htm
- DOI: https://dx.doi.org/10.12998/wjcc.v7.i21.3463


