Copyright
©The Author(s) 2019.
World J Clin Cases. Oct 26, 2019; 7(20): 3226-3236
Published online Oct 26, 2019. doi: 10.12998/wjcc.v7.i20.3226
Published online Oct 26, 2019. doi: 10.12998/wjcc.v7.i20.3226
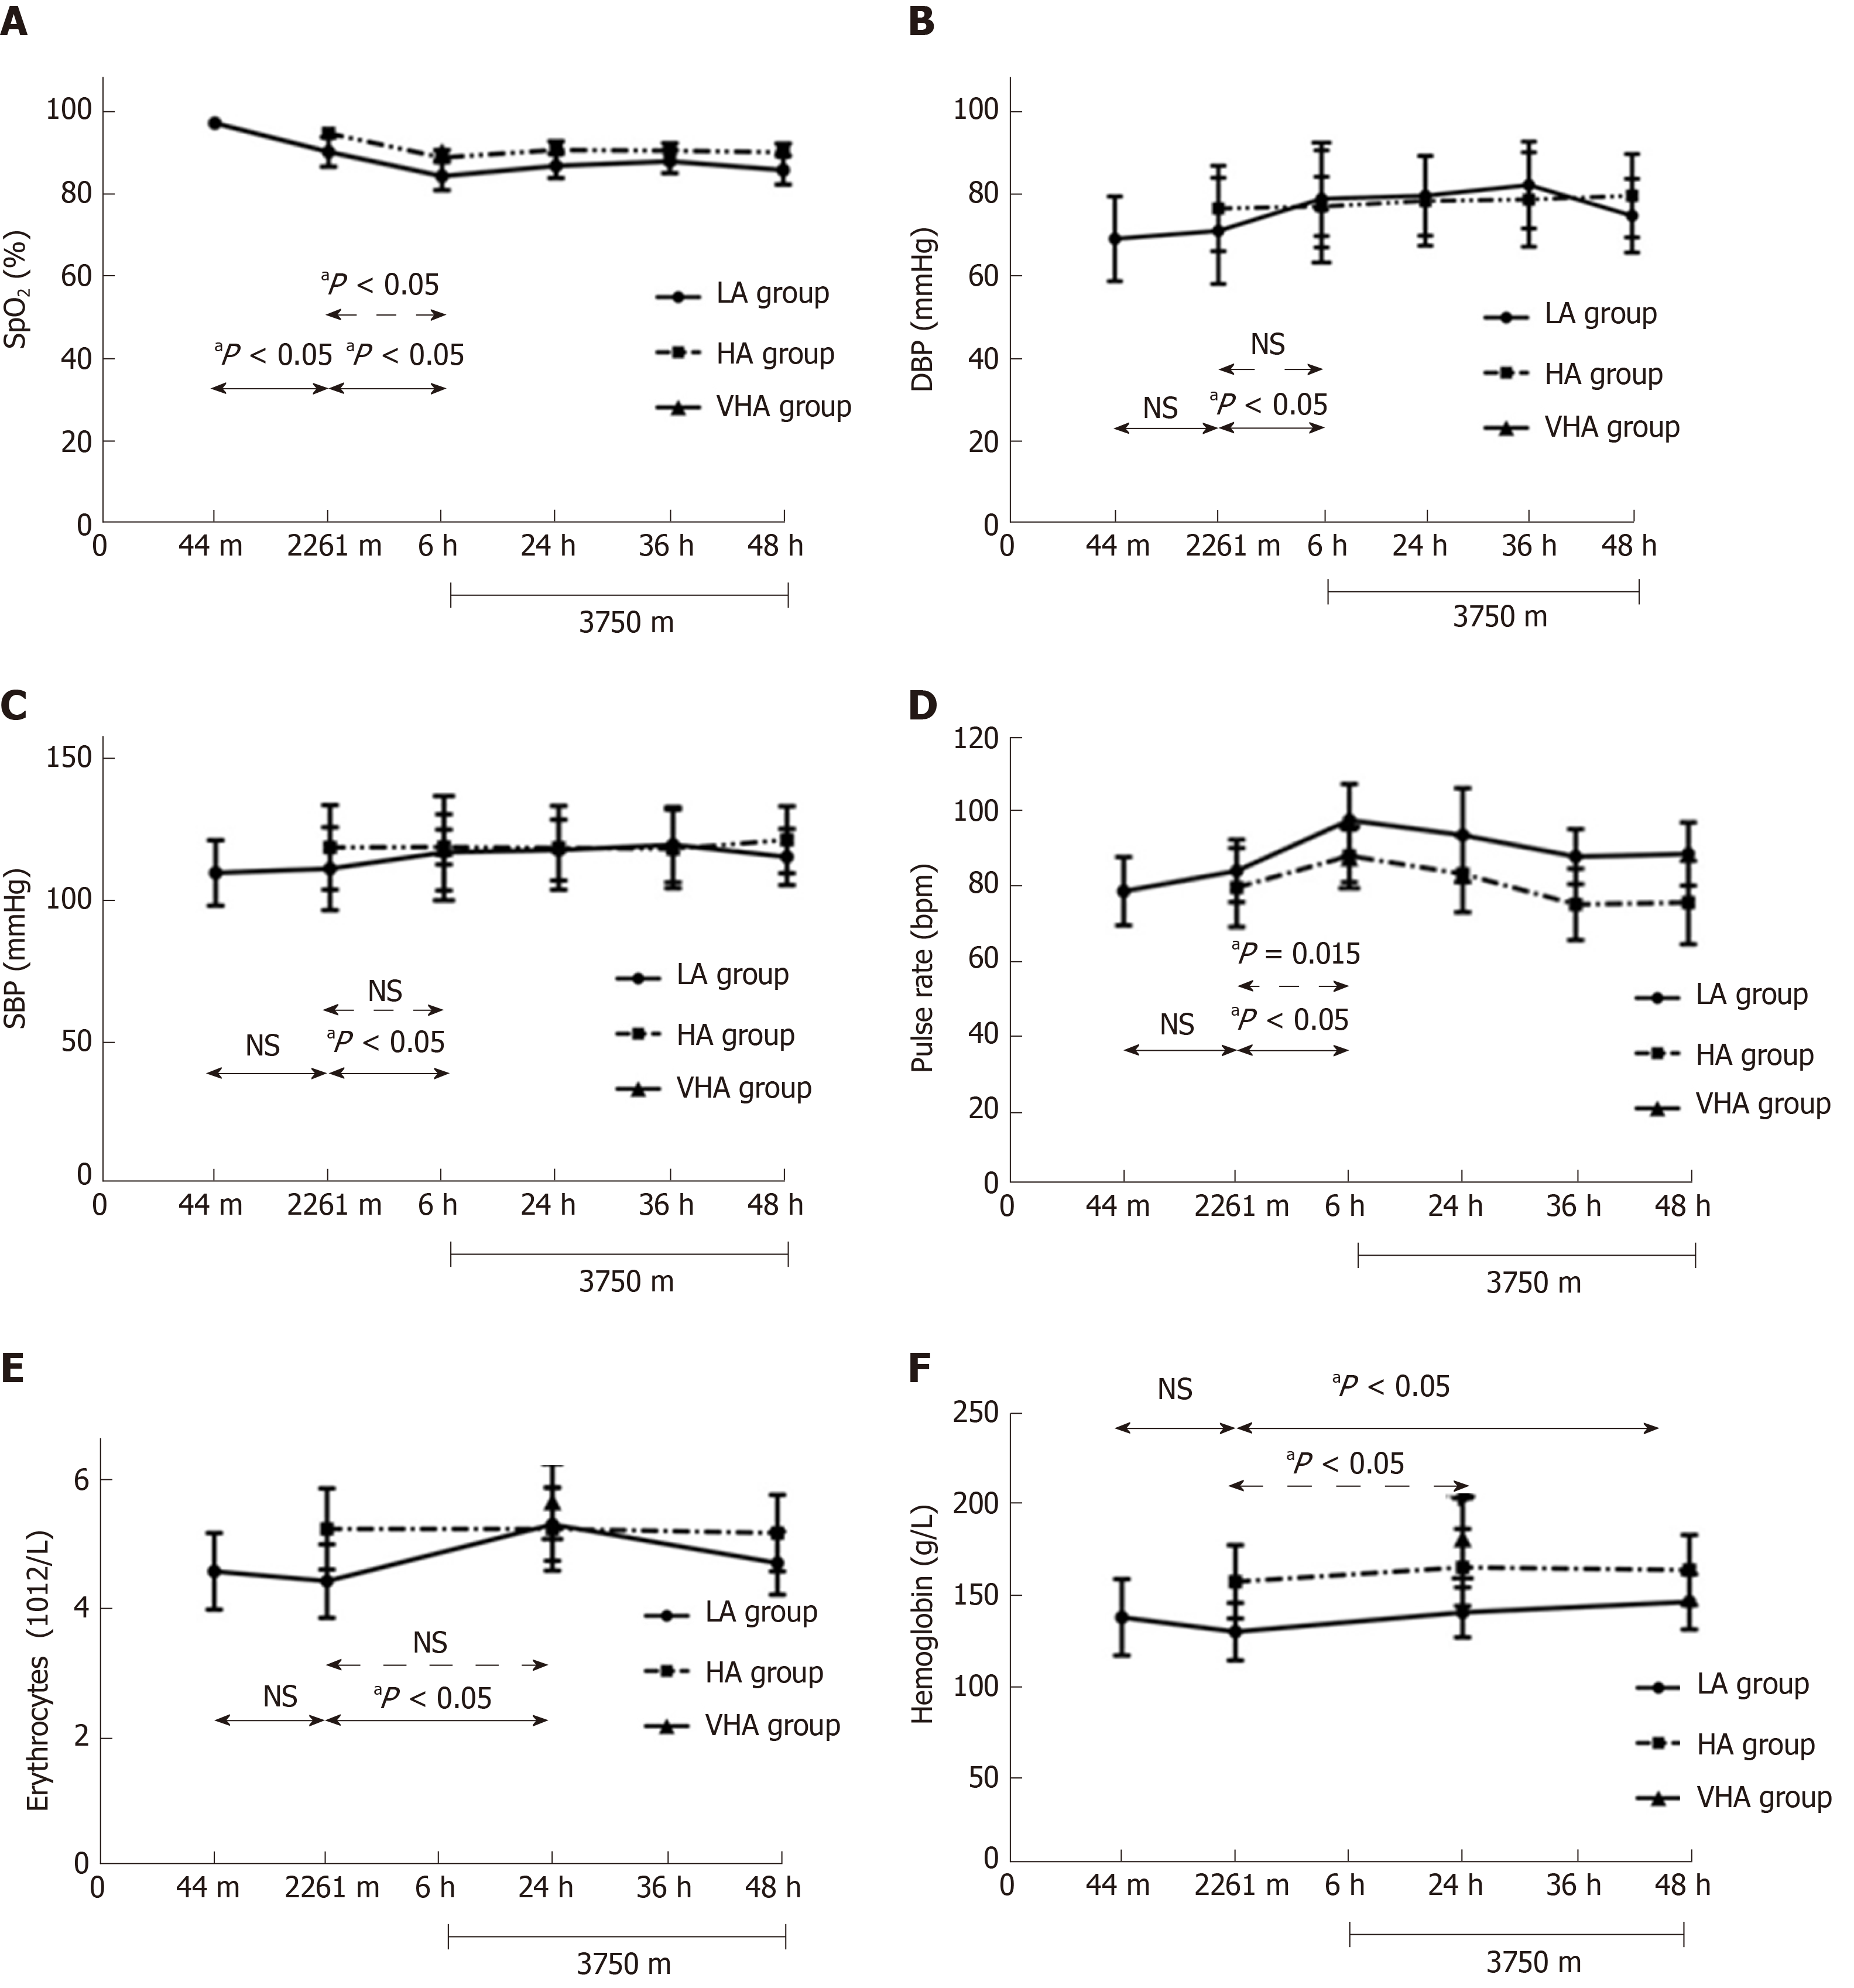
Figure 4 Linear graph showing vital and hematological parameters changes in low altitude and high altitude groups after exposure to higher altitude.
A: Oxygen saturation decreased in both groups after exposure to higher altitude; B, C: Systolic blood pressure and diastolic blood pressure in the low altitude (LA) group dropped after exposure to 3750 m above sea level (ASL); D: Pulse rate increased in both groups after exposure to 3750 m ASL; E: Erythrocytes only increased after 1 d exposure to 3750 m ASL in the LA group; F: Hemoglobin increased after flying to 3750 m ASL in both groups. aP < 0.05: Statistically significant; NS: Not significant; SpO2: Oxygen saturation; IOP: Intraocular pressure; SBP: Systolic blood pressure; DBP: Diastolic blood pressure; LA: Low altitude; HA: High altitude; VHA: Very high altitude.
- Citation: Xie Y, Sun YX, Han Y, Yang DY, Yang YQ, Cao K, Li SN, Li X, Lu XX, Wu SZ, Wang NL. Longitudinal observation of intraocular pressure variations with acute altitude changes. World J Clin Cases 2019; 7(20): 3226-3236
- URL: https://www.wjgnet.com/2307-8960/full/v7/i20/3226.htm
- DOI: https://dx.doi.org/10.12998/wjcc.v7.i20.3226


