Copyright
©The Author(s) 2019.
World J Clin Cases. Jan 26, 2019; 7(2): 171-190
Published online Jan 26, 2019. doi: 10.12998/wjcc.v7.i2.171
Published online Jan 26, 2019. doi: 10.12998/wjcc.v7.i2.171
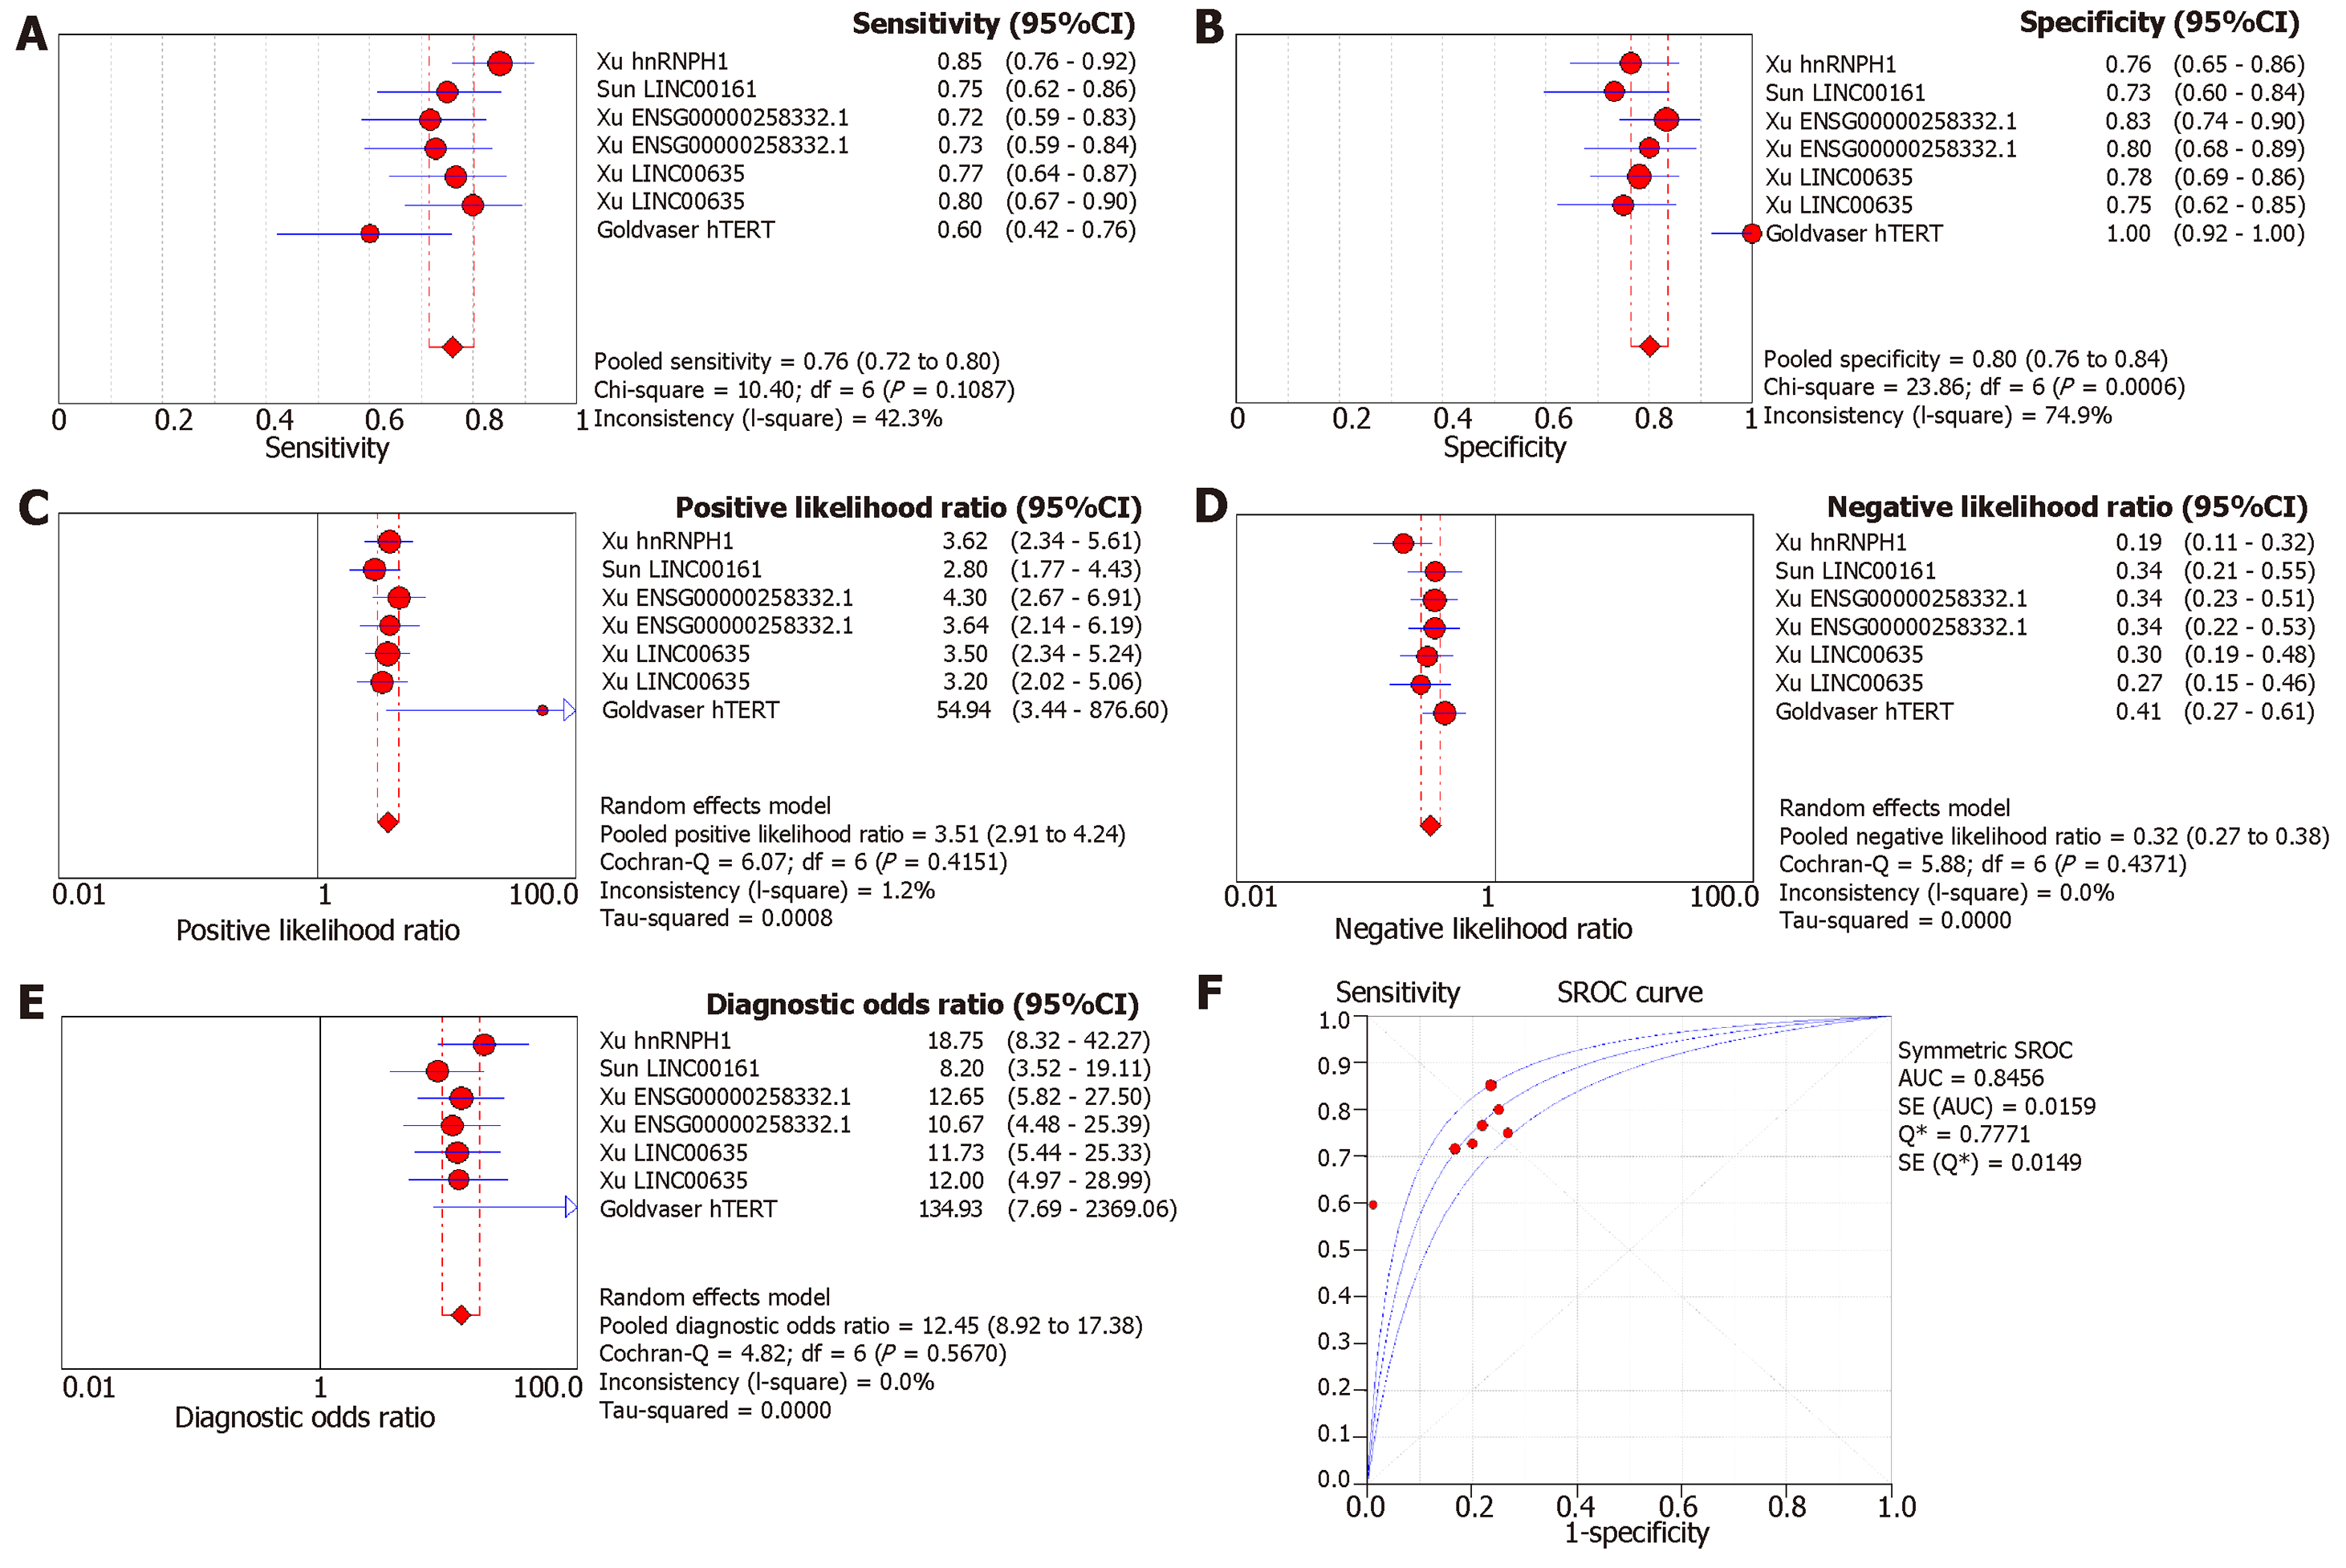
Figure 6 Forest plot of pooled (A) sensitivity, (B) specificity, (C) positive likelihood ratio, (D) negative likelihood ratio, (E) diagnostic odds ratio, and (F) SROC curve of exosomal biomarkers in diagnosis of liver cancers.
SROC: Summary receiver operating characteristic.
- Citation: Wong CH, Chen YC. Clinical significance of exosomes as potential biomarkers in cancer. World J Clin Cases 2019; 7(2): 171-190
- URL: https://www.wjgnet.com/2307-8960/full/v7/i2/171.htm
- DOI: https://dx.doi.org/10.12998/wjcc.v7.i2.171


