Copyright
©The Author(s) 2019.
World J Clin Cases. Aug 26, 2019; 7(16): 2238-2246
Published online Aug 26, 2019. doi: 10.12998/wjcc.v7.i16.2238
Published online Aug 26, 2019. doi: 10.12998/wjcc.v7.i16.2238
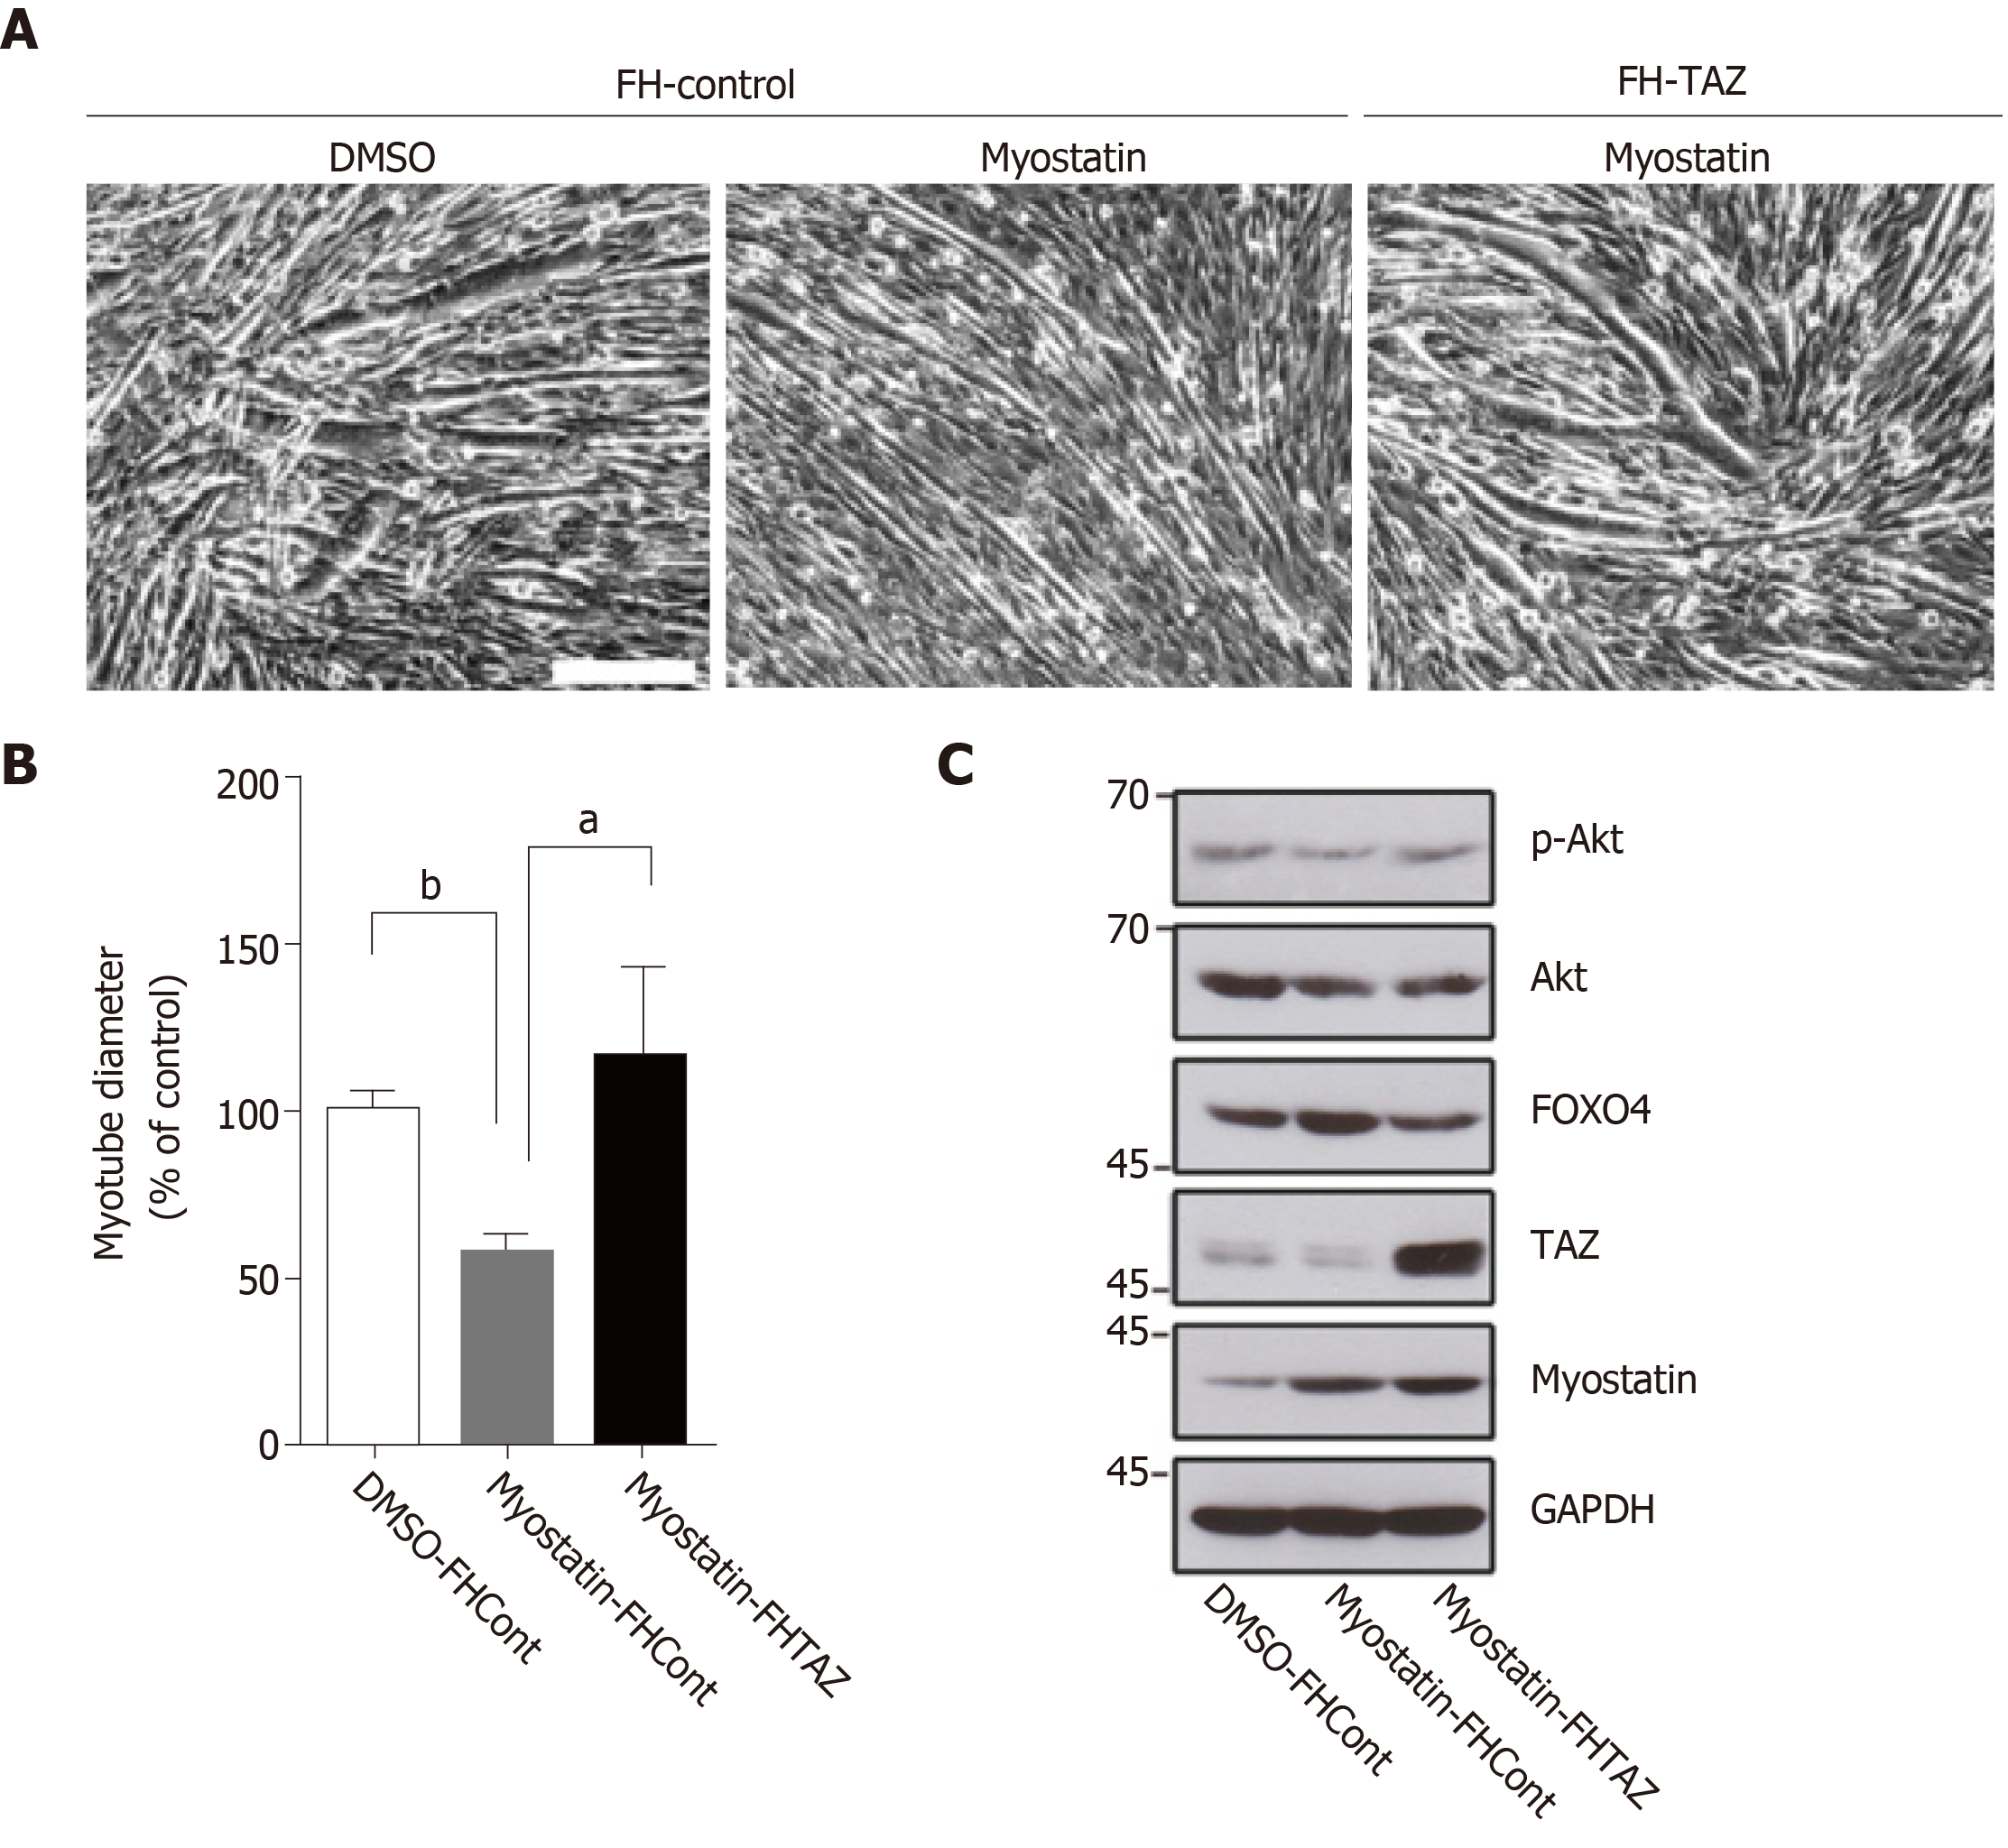
Figure 3 Myotube formation in each group of C2C12 cells and protein expression.
A: Images of the myotube formation. Bar: 100 μm; B: Quantitative data and statistical analysis of myotube diameter in each group. aP < 0.05, bP < 0.01; C: Western blotting showing protein expression; GAPDH was used as the loading control.
- Citation: Sun JX, Yang ZY, Xie LM, Wang B, Bai N, Cai AL. TAZ and myostatin involved in muscle atrophy of congenital neurogenic clubfoot. World J Clin Cases 2019; 7(16): 2238-2246
- URL: https://www.wjgnet.com/2307-8960/full/v7/i16/2238.htm
- DOI: https://dx.doi.org/10.12998/wjcc.v7.i16.2238


