Copyright
©The Author(s) 2019.
World J Clin Cases. Aug 26, 2019; 7(16): 2189-2203
Published online Aug 26, 2019. doi: 10.12998/wjcc.v7.i16.2189
Published online Aug 26, 2019. doi: 10.12998/wjcc.v7.i16.2189
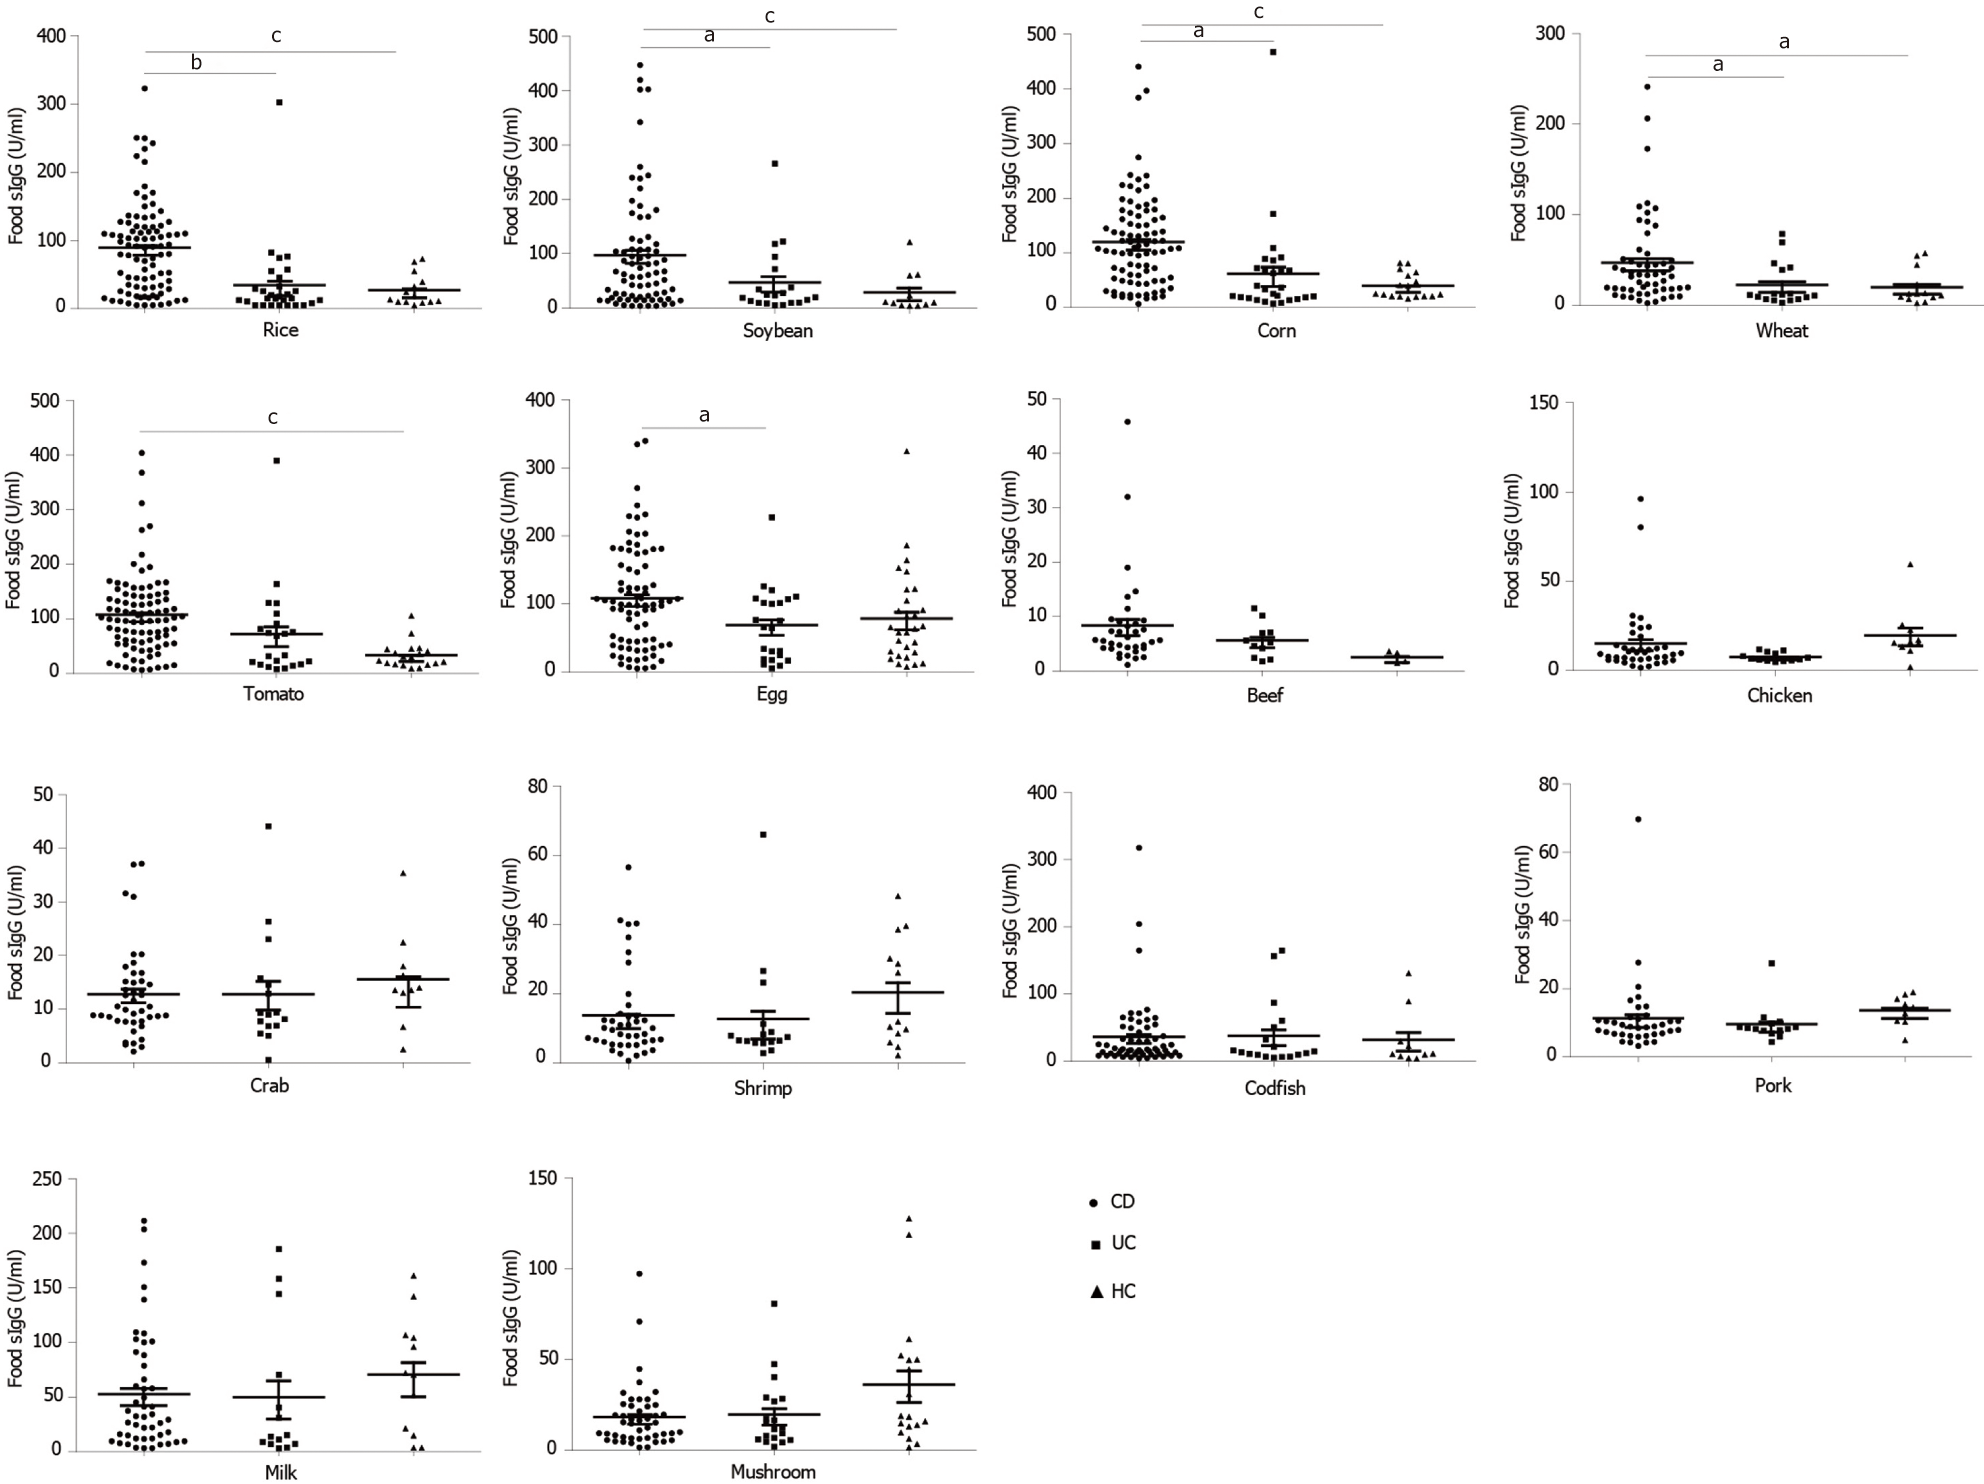
Figure 3 The levels of food-specific IgG against 14 common daily foods in CD patients, UC patients and HCs.
Statistics: ANOVA, aP < 0.05, bP < 0.01, cP < 0.001. UC: Ulcerative colitis; CD: Crohn’s disease; HCs: Healthy controls; ANOVA: One-way analysis of variance.
- Citation: Wang HY, Li Y, Li JJ, Jiao CH, Zhao XJ, Li XT, Lu MJ, Mao XQ, Zhang HJ. Serological investigation of IgG and IgE antibodies against food antigens in patients with inflammatory bowel disease. World J Clin Cases 2019; 7(16): 2189-2203
- URL: https://www.wjgnet.com/2307-8960/full/v7/i16/2189.htm
- DOI: https://dx.doi.org/10.12998/wjcc.v7.i16.2189


