Copyright
©The Author(s) 2019.
World J Clin Cases. Aug 26, 2019; 7(16): 2155-2164
Published online Aug 26, 2019. doi: 10.12998/wjcc.v7.i16.2155
Published online Aug 26, 2019. doi: 10.12998/wjcc.v7.i16.2155
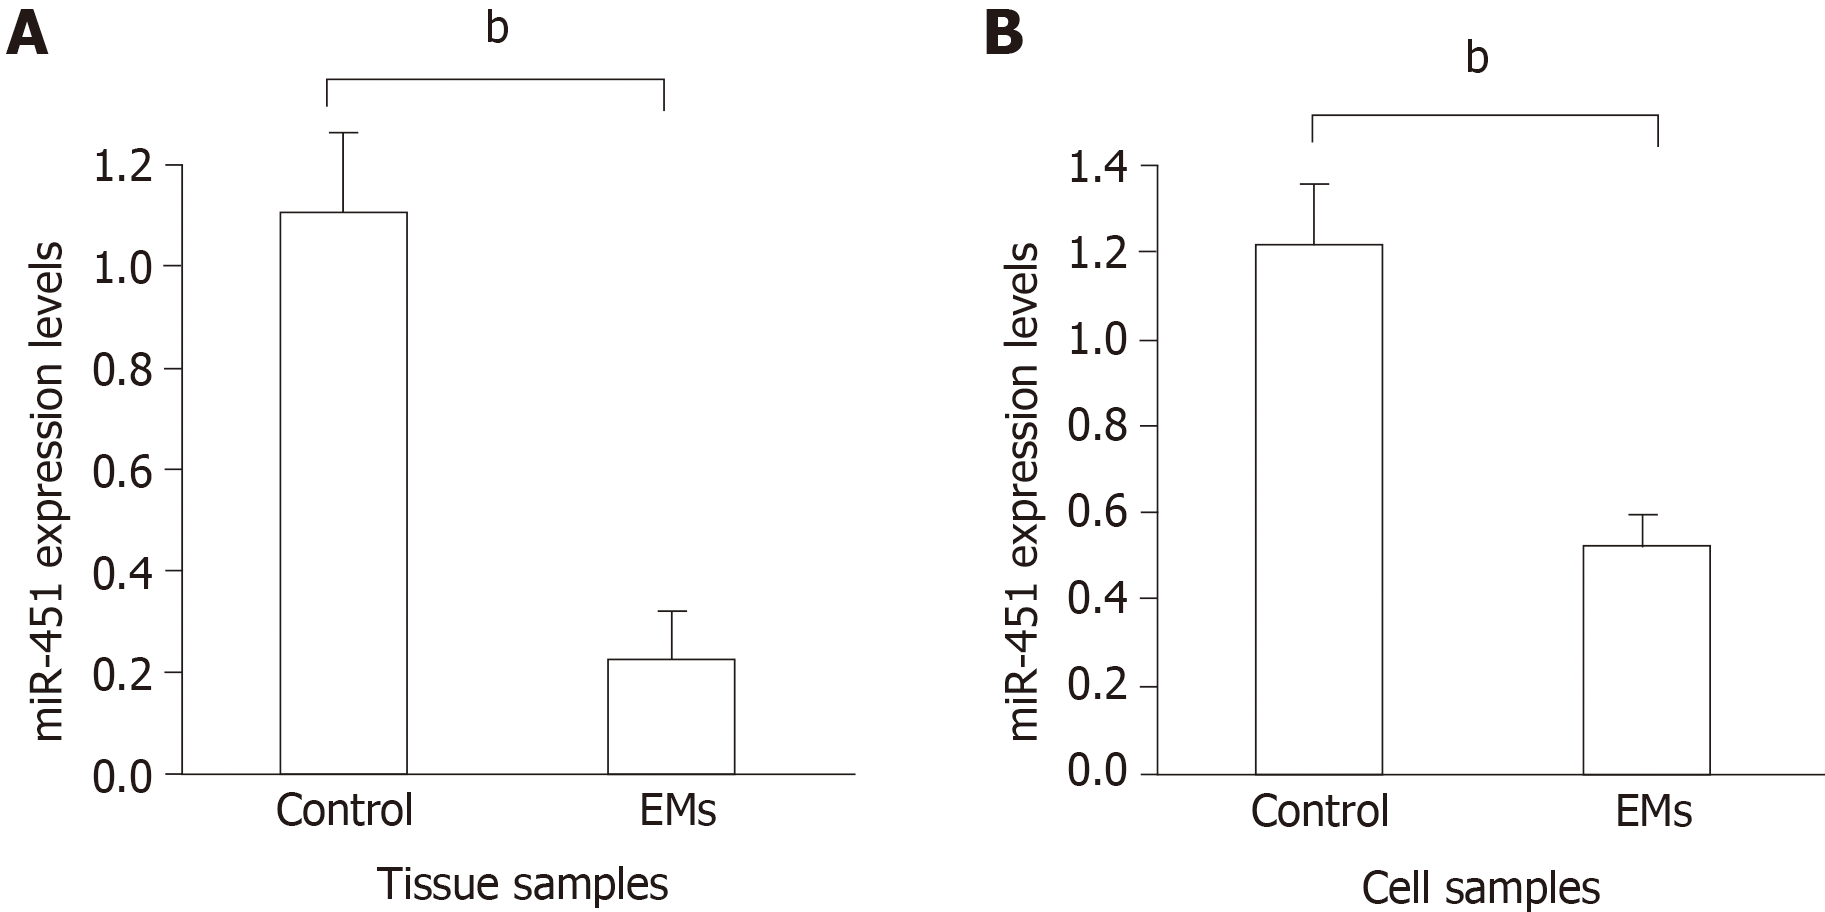
Figure 1 Expression of miR-451 in eutopic tissues and cell lines.
A: MiR-451 expression in eutopic tissues from endometriosis (EMs) and control groups was quantified using quantitative real-time PCR. Data are expressed as 2−ΔΔCt (mean ± SE, n = 4). bP < 0.01 vs control; B: Expression of miR-451 was compared between EMs and control cell lines. Data are expressed as 2−ΔΔCt (mean ± SEM, n = 4). bP < 0.01 vs control.
- Citation: Gao S, Liu S, Gao ZM, Deng P, Wang DB. Reduced microRNA-451 expression in eutopic endometrium contributes to the pathogenesis of endometriosis. World J Clin Cases 2019; 7(16): 2155-2164
- URL: https://www.wjgnet.com/2307-8960/full/v7/i16/2155.htm
- DOI: https://dx.doi.org/10.12998/wjcc.v7.i16.2155


