Copyright
©The Author(s) 2019.
World J Clin Cases. Aug 6, 2019; 7(15): 1978-1985
Published online Aug 6, 2019. doi: 10.12998/wjcc.v7.i15.1978
Published online Aug 6, 2019. doi: 10.12998/wjcc.v7.i15.1978
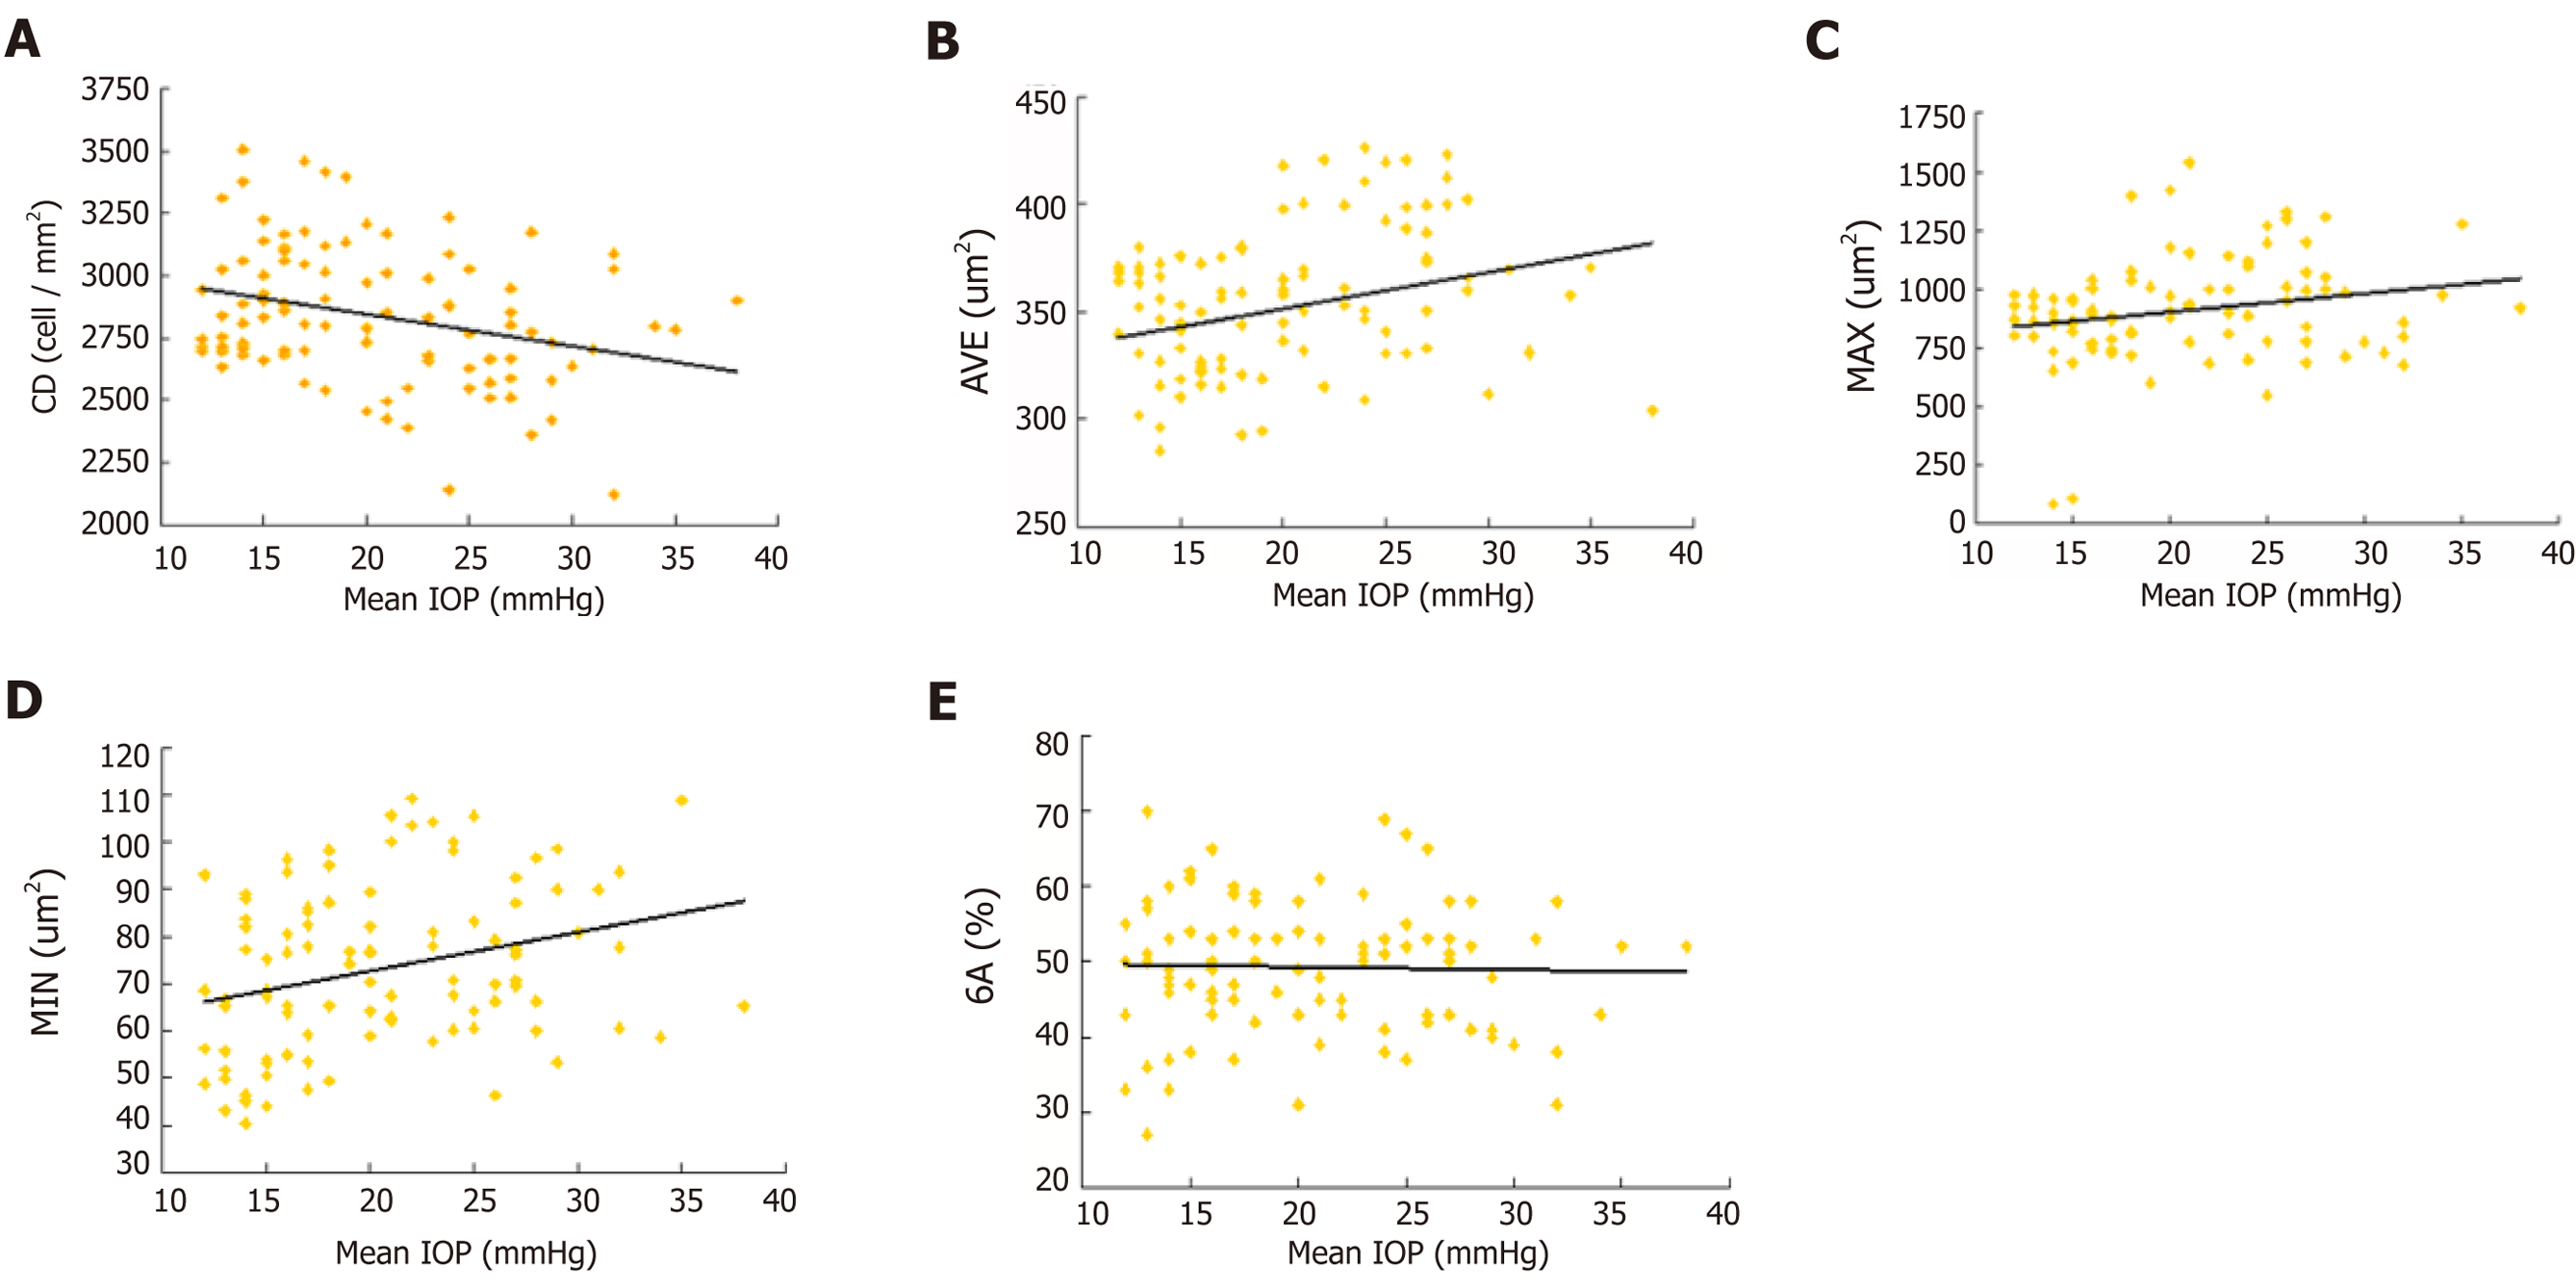
Figure 2 Correlations between endothelial cell characteristics and intraocular pressure.
Scatterplots showing the relationship between corneal endothelial cell characteristics and intraocular pressure (IOP). A: There was a negative correlation between cell density and mean IOP (r = -0.286, P = 0.004); B: Positive correlations were found between the average of cell area and mean IOP (r = 0.228, P = 0.022); C: Maximum cell area and mean IOP (r = 0.218, P = 0.029); D: Minimum cell area and mean IOP (r = 0.290, P = 0.003); E: The percentage of hexagonal cells was not correlated with mean IOP. CD: Endothelial cell density; AVG: Average of cell area; MAX: Maximum cell area; MIN: Minimum cell area; GA: Percentage of hexagonal cells.
- Citation: Yu ZY, Wu L, Qu B. Changes in corneal endothelial cell density in patients with primary open-angle glaucoma. World J Clin Cases 2019; 7(15): 1978-1985
- URL: https://www.wjgnet.com/2307-8960/full/v7/i15/1978.htm
- DOI: https://dx.doi.org/10.12998/wjcc.v7.i15.1978


