Copyright
©The Author(s) 2019.
World J Clin Cases. Jul 26, 2019; 7(14): 1857-1864
Published online Jul 26, 2019. doi: 10.12998/wjcc.v7.i14.1857
Published online Jul 26, 2019. doi: 10.12998/wjcc.v7.i14.1857
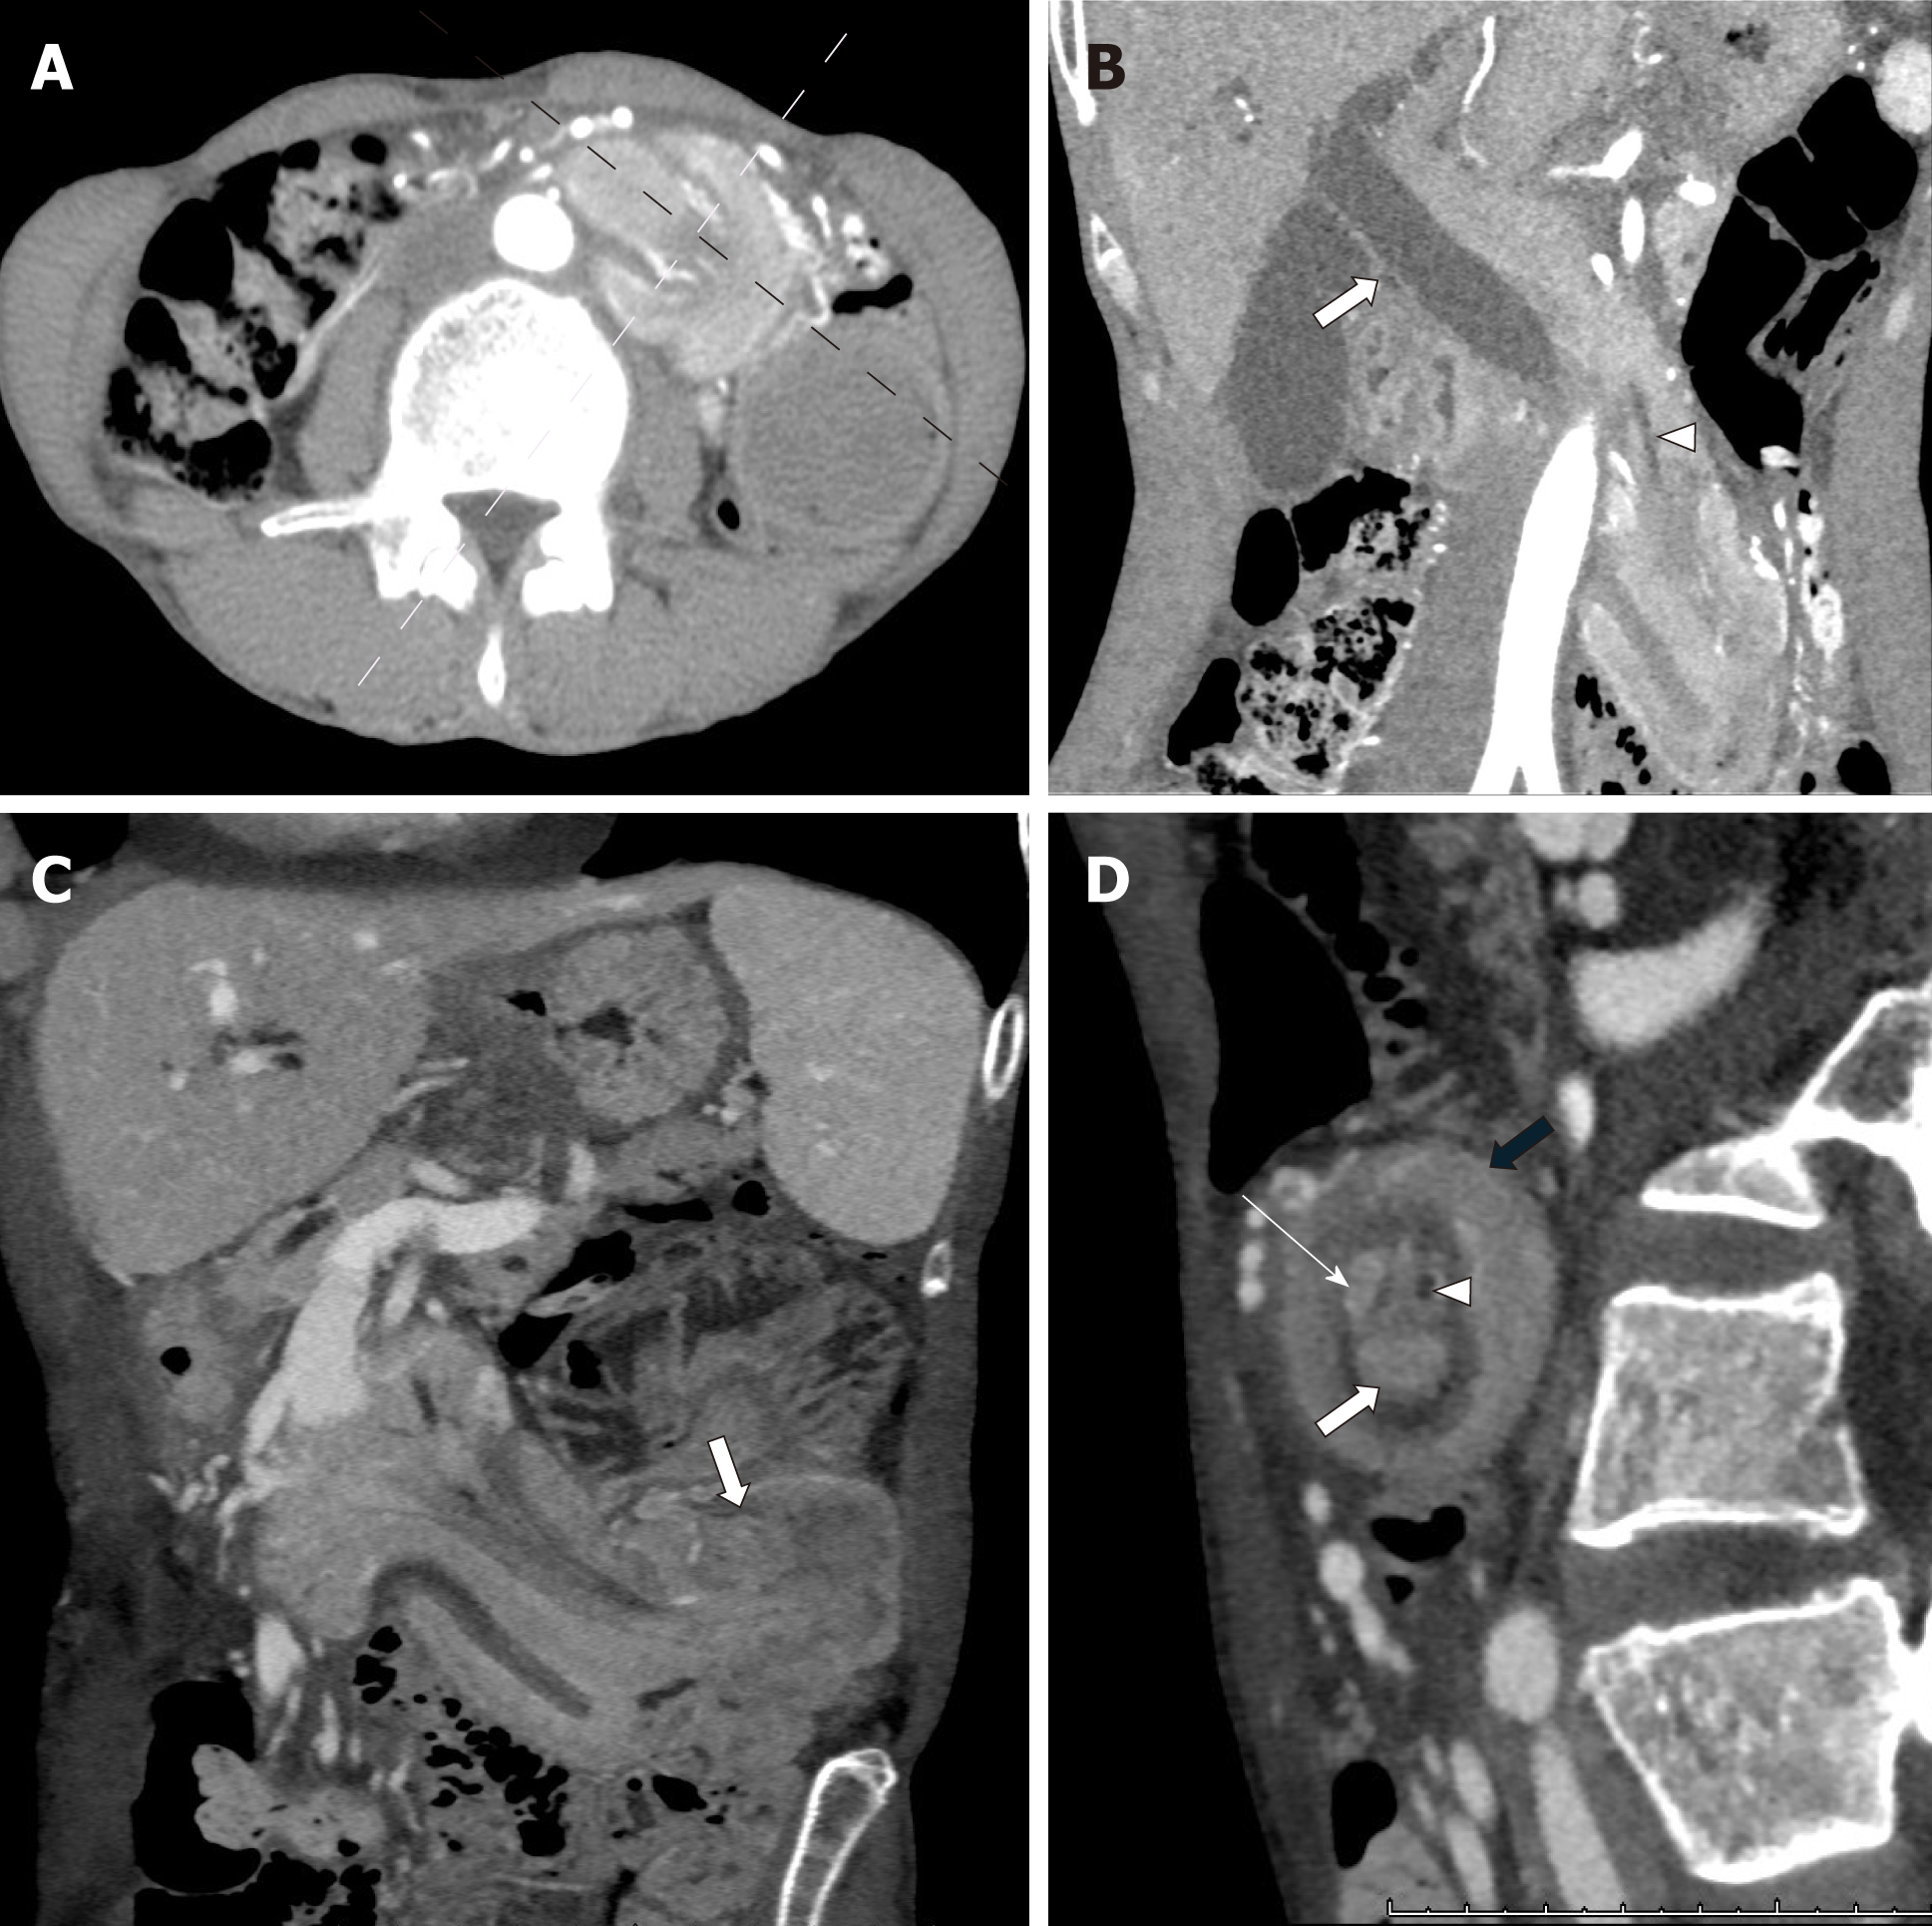
Figure 4 Follow-up abdominal computed tomography 3 d after admission.
A: Axial computed tomography (CT) shows duodenal intussusception; B: Coronal CT indicates further deviation toward the left-lower direction of the whole structures surrounding the ampulla, including the common bile duct (white arrow) and the major pancreatic duct (white arrowhead); C: The CT beam is parallel to the longitudinal axis of the intussusception (black dotted line in A). A tumor as the lead point (white arrow) and retroperitoneal structure, including the head of the pancreas and fat, invaginate beyond the duodenojejunal flexure to the jejunum; D: The CT beam is perpendicular to the longitudinal axis of the intussusception (white dotted line in A). The target sign has fatty elements, including the pancreatic parenchyma (white thin arrow) and pancreatic duct (white arrowhead), in addition to the intussusceptum (white thick arrow) and intussuscipiens (black thick arrow).
- Citation: Hirata M, Shirakata Y, Yamanaka K. Duodenal intussusception secondary to ampullary adenoma: A case report. World J Clin Cases 2019; 7(14): 1857-1864
- URL: https://www.wjgnet.com/2307-8960/full/v7/i14/1857.htm
- DOI: https://dx.doi.org/10.12998/wjcc.v7.i14.1857


