Copyright
©The Author(s) 2019.
World J Clin Cases. Jul 6, 2019; 7(13): 1677-1685
Published online Jul 6, 2019. doi: 10.12998/wjcc.v7.i13.1677
Published online Jul 6, 2019. doi: 10.12998/wjcc.v7.i13.1677
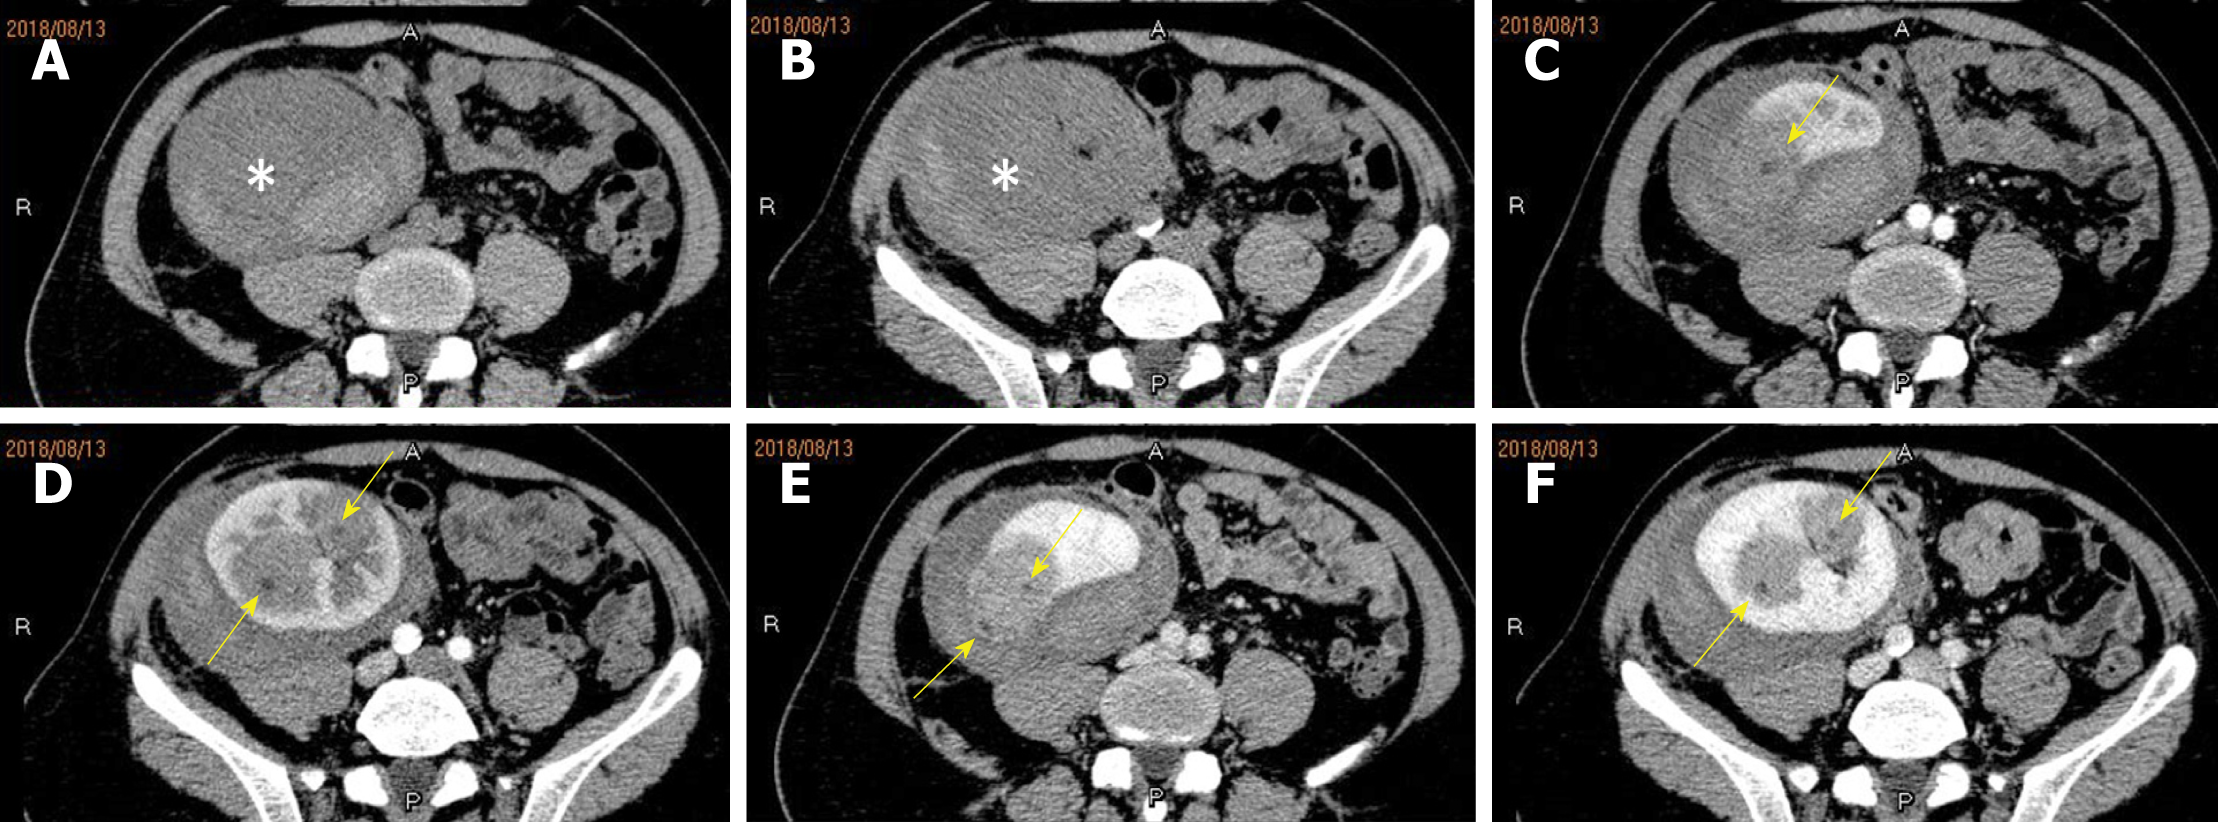
Figure 5 Contrast-enhanced computed tomography showed that the neoplasms became bigger one month later.
A and B: Non-enhancing images showing slightly hyper-density neoplasms (white stars) without distinct margins; C-F: Enhanced multiphase computed tomography image revealing slow, heterogeneous enhancement inside the neoplasms, with few spotty and patchy non-enhanced foci (yellow arrows); E and F: The venous phase images showing more clear margins than other phases.
- Citation: Xu RF, He EH, Yi ZX, Lin J, Zhang YN, Qian LX. Multimodality-imaging manifestations of primary renal-allograft synovial sarcoma: First case report and literature review. World J Clin Cases 2019; 7(13): 1677-1685
- URL: https://www.wjgnet.com/2307-8960/full/v7/i13/1677.htm
- DOI: https://dx.doi.org/10.12998/wjcc.v7.i13.1677


