Copyright
©The Author(s) 2019.
World J Clin Cases. May 26, 2019; 7(10): 1155-1160
Published online May 26, 2019. doi: 10.12998/wjcc.v7.i10.1155
Published online May 26, 2019. doi: 10.12998/wjcc.v7.i10.1155
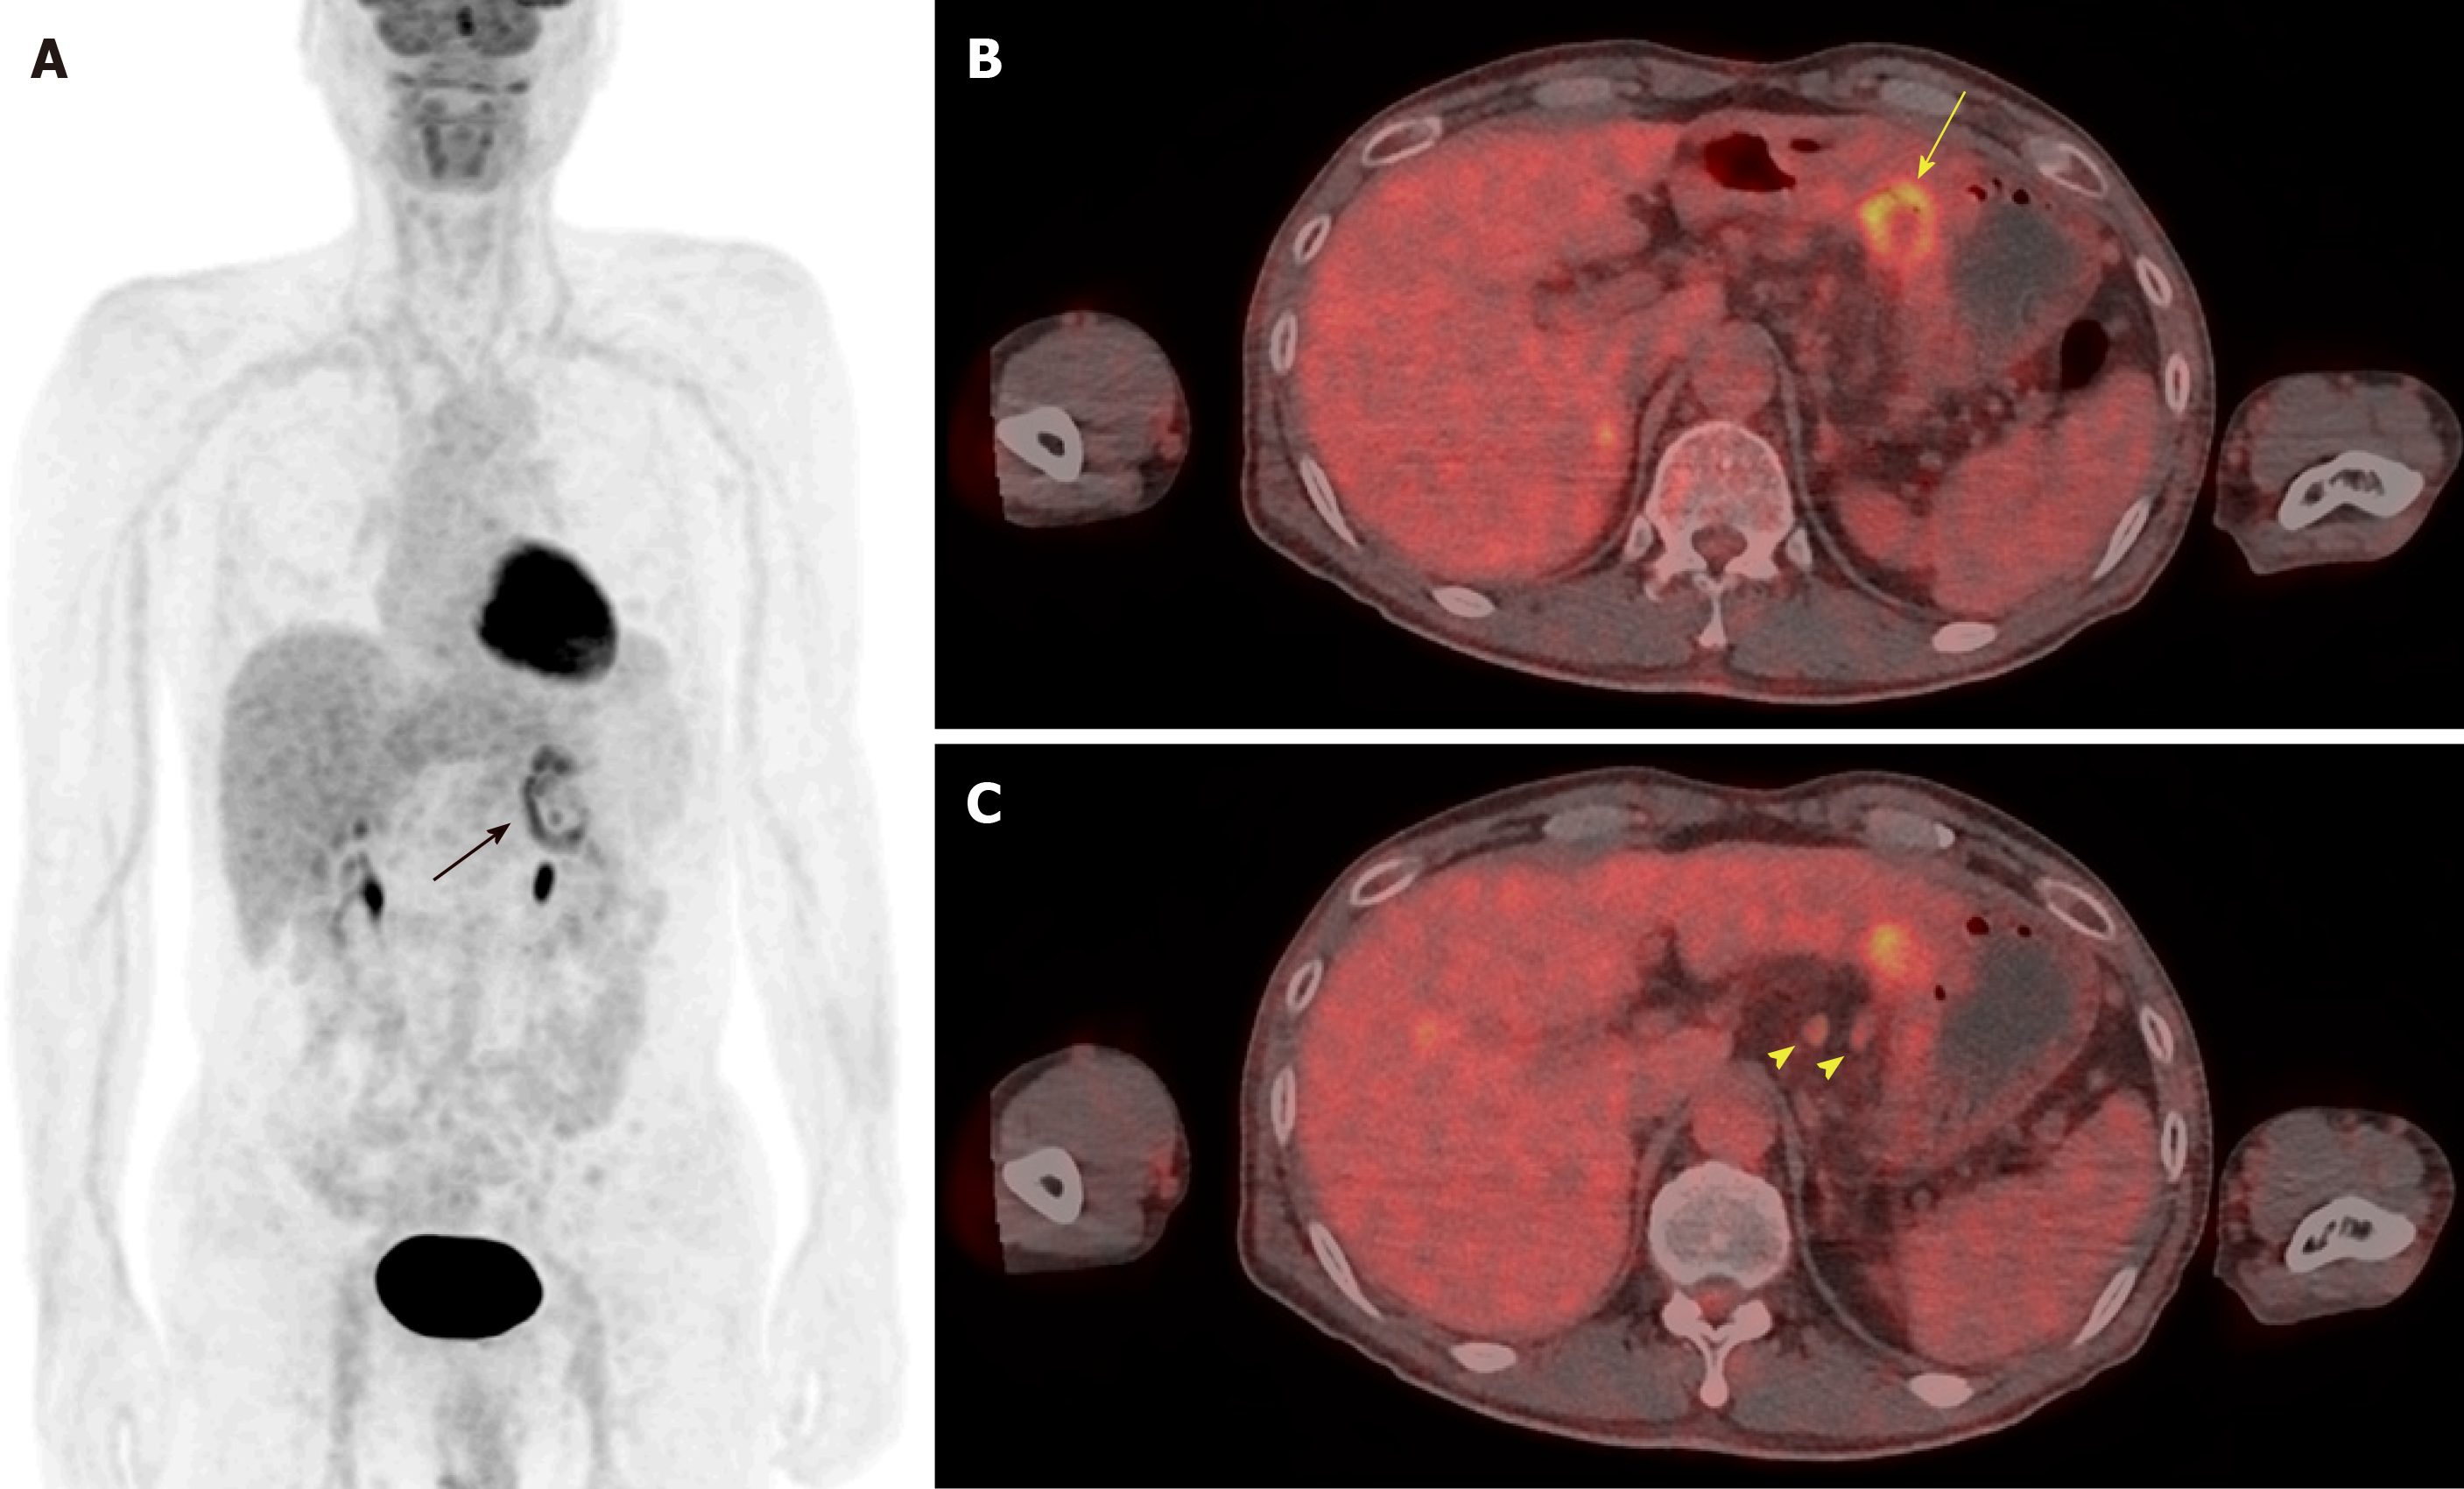
Figure 3 F-18 fluorodeoxyglucose positron emission tomography/computed tomography images.
A: The maximum intensity projection image shows uneven uptake on the stomach (black arrow); B: Axial scan shows increased uptake in the posterior wall of the lower body of the stomach (yellow arrow); C: Several enlarged hypermetabolic lymph nodes were seen at the left gastric chain (yellow arrow head).
- Citation: Song BI. F-18 fluorodeoxyglucose positron emission tomography/computed tomography image of gastric mucormycosis mimicking advanced gastric cancer: A case report. World J Clin Cases 2019; 7(10): 1155-1160
- URL: https://www.wjgnet.com/2307-8960/full/v7/i10/1155.htm
- DOI: https://dx.doi.org/10.12998/wjcc.v7.i10.1155


