Copyright
©The Author(s) 2018.
World J Clin Cases. Jun 16, 2018; 6(6): 99-109
Published online Jun 16, 2018. doi: 10.12998/wjcc.v6.i6.99
Published online Jun 16, 2018. doi: 10.12998/wjcc.v6.i6.99
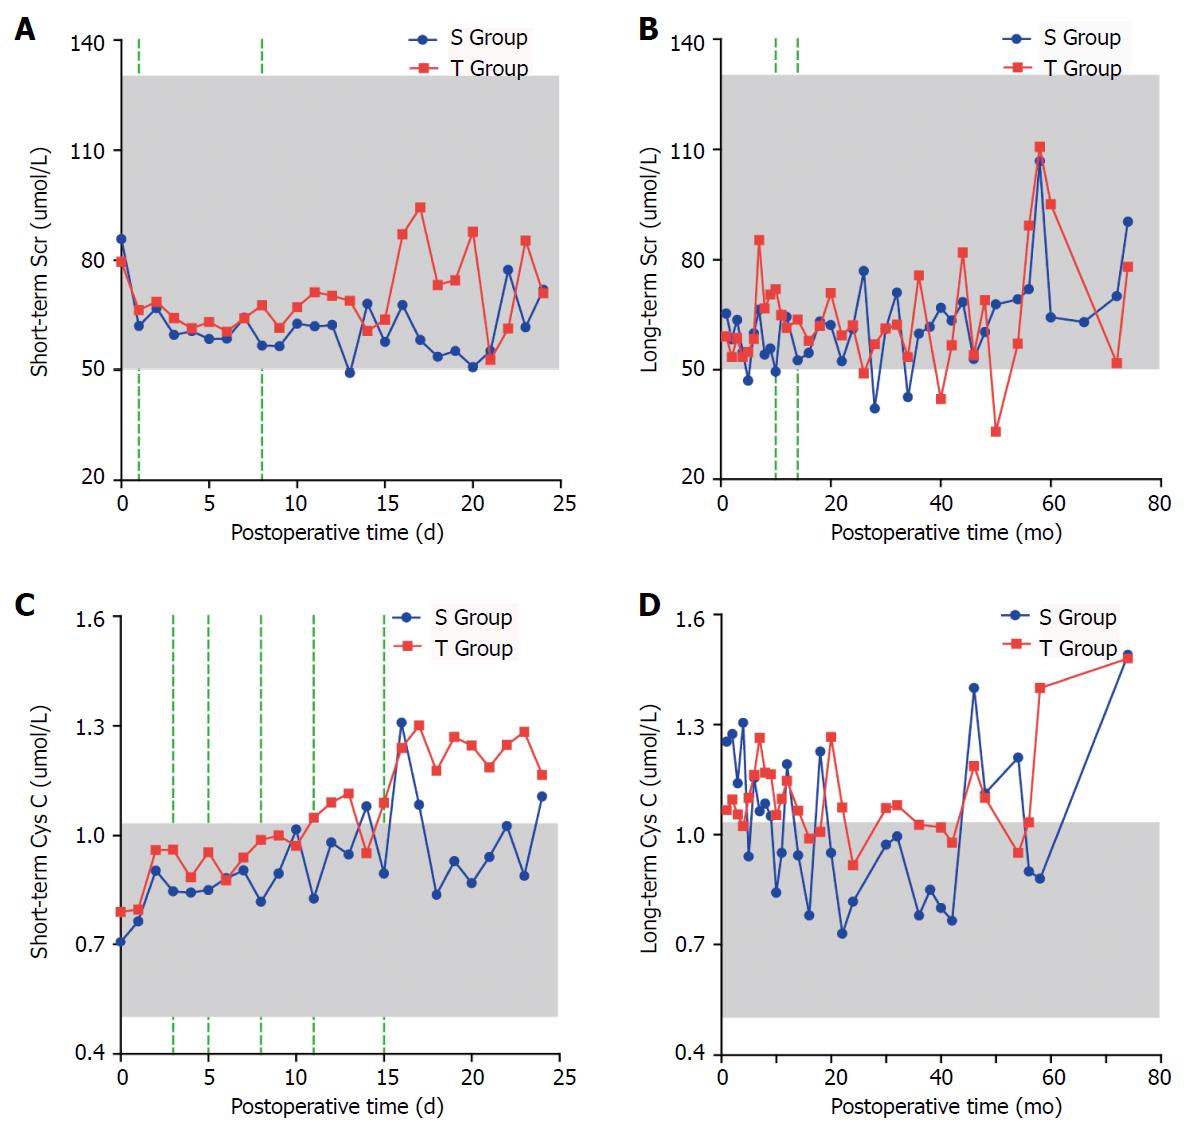
Figure 4 Comparison of short-term and long-term renal function after the operation.
A: Comparison of short-term serum creatinine after the operation; B: Comparison of long-term serum creatinine after the operation; C: Comparison of short-term cystatin C after the operation; D: Comparison of long-term cystatin C after the operation. Shadow: Normal range of reference values; Green dotted line: Time points with statistically significant differences (P < 0.05); Scr: Serum creatinine; Cys C: Cystatin C.
- Citation: Zhang YF, Ji H, Lu HW, Lu L, Wang L, Wang JL, Li YM. Comparison of simplified and traditional pericardial devascularisation combined with splenectomy for the treatment of portal hypertension. World J Clin Cases 2018; 6(6): 99-109
- URL: https://www.wjgnet.com/2307-8960/full/v6/i6/99.htm
- DOI: https://dx.doi.org/10.12998/wjcc.v6.i6.99


