Copyright
©The Author(s) 2018.
World J Clin Cases. Nov 26, 2018; 6(14): 800-806
Published online Nov 26, 2018. doi: 10.12998/wjcc.v6.i14.800
Published online Nov 26, 2018. doi: 10.12998/wjcc.v6.i14.800
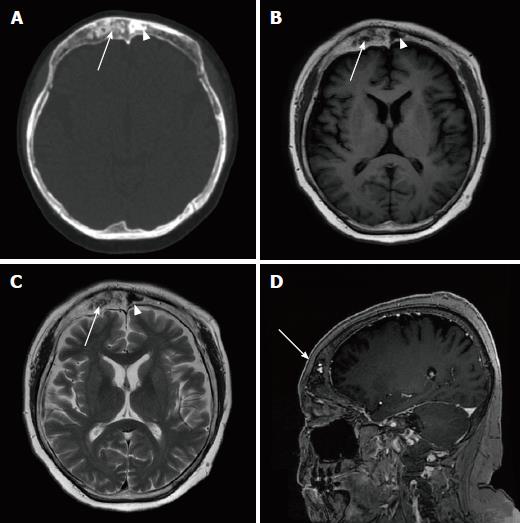
Figure 6 Computed tomography and magnetic resonance imaging images of Patient 2.
A: Axial skull computed tomography image showing the thickened frontal bone with both sclerotic lesion (arrow head) and lytic lesion (arrow); B: Axial T1-weighted imaging showing that both the sclerotic lesion and the lytic lesion were hypointense; C: Axial T2-weighted imaging showing that the sclerotic lesion was hypointense and the lytic part was slightly hyperintense; D: Sagittal post-contrast T1-weighted imaging showing that the lytic lesion was remarkably enhanced on sagittal post-contrast T1-weighted imaging (arrow).
- Citation: Li S, Duan L, Wang FD, Lu L, Jin ZY. Carney complex: Two case reports and review of literature. World J Clin Cases 2018; 6(14): 800-806
- URL: https://www.wjgnet.com/2307-8960/full/v6/i14/800.htm
- DOI: https://dx.doi.org/10.12998/wjcc.v6.i14.800


