Copyright
©The Author(s) 2018.
World J Clin Cases. Oct 6, 2018; 6(11): 426-440
Published online Oct 6, 2018. doi: 10.12998/wjcc.v6.i11.426
Published online Oct 6, 2018. doi: 10.12998/wjcc.v6.i11.426
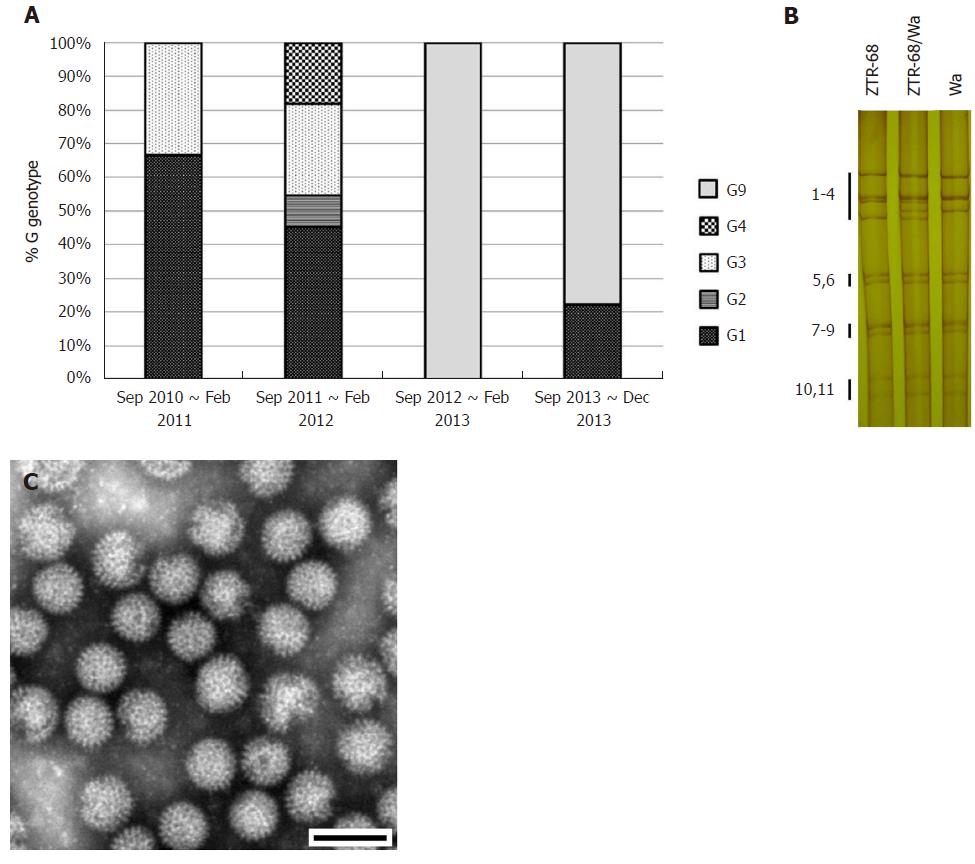
Figure 3 Rotavirus G genotype distribution and characterization of strain ZTR-68.
A: Rotavirus G genotype distribution during rotavirus peak season (September to February) from 2010 to 2013, on the basis of rotavirus VP7 genes sequences analysis; B: Electrophoretic pattern of ZTR-68/Wa. Electrophoretic migration pattern of RNA from rotavirus. Viral genomic dsRNAs extracted were separated in 10% polyacrylamide gels and visualized by silver staining. Numbers indicate the order of the ZTR-68 and Wa gene segments; C: Rotavirus strain ZTR-68, Bar = 100 nm.
- Citation: Wu JY, Zhou Y, Zhang GM, Mu GF, Yi S, Yin N, Xie YP, Lin XC, Li HJ, Sun MS. Isolation and characterization of a new candidate human inactivated rotavirus vaccine strain from hospitalized children in Yunnan, China: 2010-2013. World J Clin Cases 2018; 6(11): 426-440
- URL: https://www.wjgnet.com/2307-8960/full/v6/i11/426.htm
- DOI: https://dx.doi.org/10.12998/wjcc.v6.i11.426


