Copyright
©The Author(s) 2018.
World J Clin Cases. Oct 6, 2018; 6(11): 426-440
Published online Oct 6, 2018. doi: 10.12998/wjcc.v6.i11.426
Published online Oct 6, 2018. doi: 10.12998/wjcc.v6.i11.426
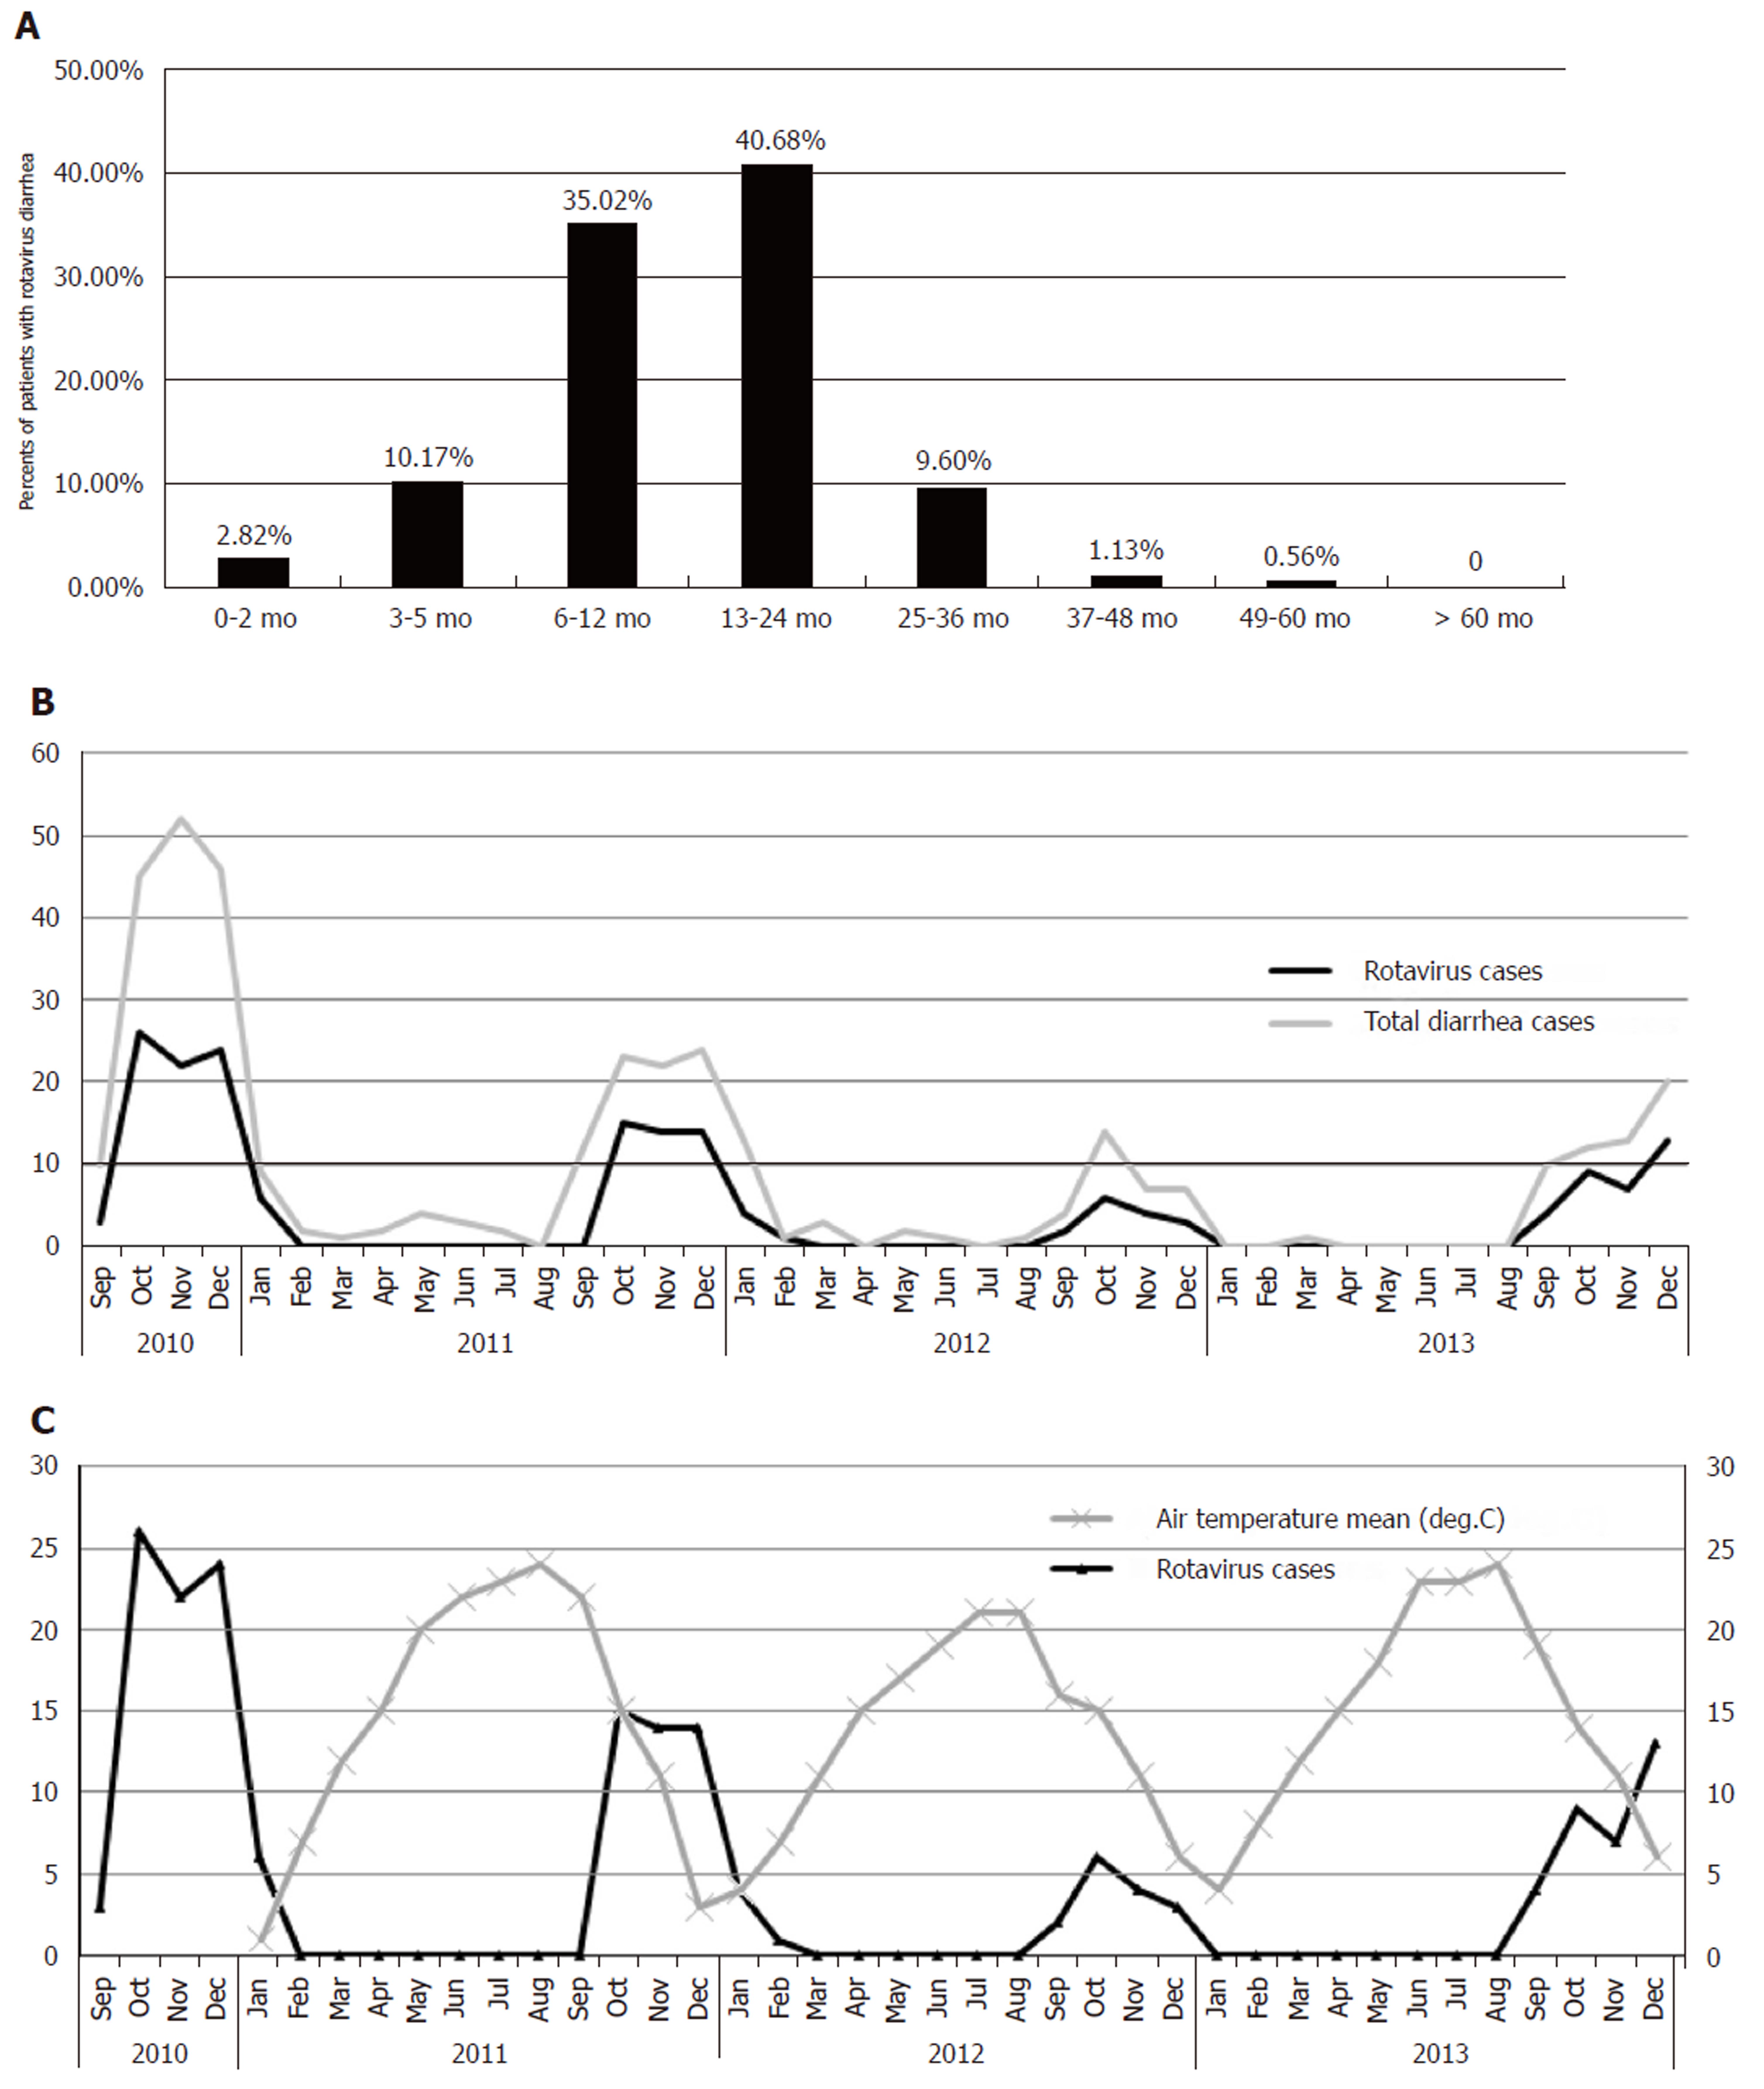
Figure 2 Age distribution and trends in number and proportion of gastroenteritis of rotavirus diarrhea cases from 2010 to 2013 in Yunnan, China.
A: Age distribution of rotavirus diarrhea cases from 2010 to 2013; B: Trends in number and proportion of gastroenteritis by rotavirus antigen over the study period. The scale bar on the left represents the number of rotavirus cases and total diarrhea cases; C The mean daily temperature of Yunnan from January 2011 to December 2013 compared to the number of rotavirus cases.
- Citation: Wu JY, Zhou Y, Zhang GM, Mu GF, Yi S, Yin N, Xie YP, Lin XC, Li HJ, Sun MS. Isolation and characterization of a new candidate human inactivated rotavirus vaccine strain from hospitalized children in Yunnan, China: 2010-2013. World J Clin Cases 2018; 6(11): 426-440
- URL: https://www.wjgnet.com/2307-8960/full/v6/i11/426.htm
- DOI: https://dx.doi.org/10.12998/wjcc.v6.i11.426


