Copyright
©The Author(s) 2017.
World J Clin Cases. Mar 16, 2017; 5(3): 82-92
Published online Mar 16, 2017. doi: 10.12998/wjcc.v5.i3.82
Published online Mar 16, 2017. doi: 10.12998/wjcc.v5.i3.82
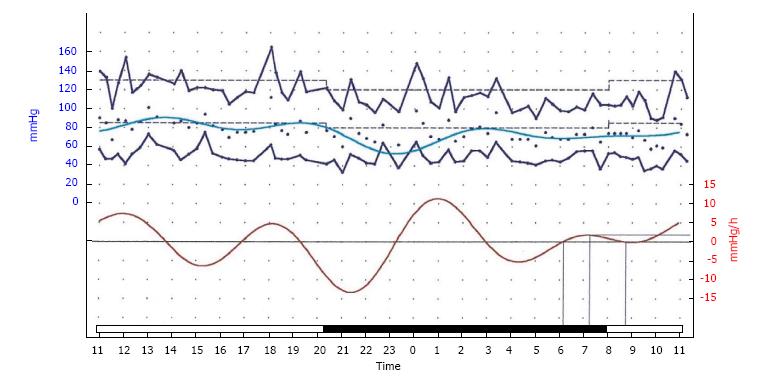
Figure 13 Rate of rise and fall of systolic pressure during the 24 h.
The rate is shown by the red line with the mmHg rise/hour noted on the right vertical axis.
- Citation: Bloomfield DA, Park A. Decoding white coat hypertension. World J Clin Cases 2017; 5(3): 82-92
- URL: https://www.wjgnet.com/2307-8960/full/v5/i3/82.htm
- DOI: https://dx.doi.org/10.12998/wjcc.v5.i3.82


