Copyright
©The Author(s) 2017.
World J Clin Cases. Mar 16, 2017; 5(3): 82-92
Published online Mar 16, 2017. doi: 10.12998/wjcc.v5.i3.82
Published online Mar 16, 2017. doi: 10.12998/wjcc.v5.i3.82
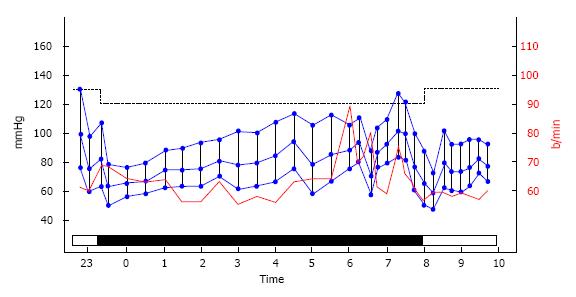
Figure 10 Elevated nighttime blood pressure and pulse rate.
The recorded pressure in mmHg is noted on the left vertical axis. Right axis shows the recorded pulse rate in beats per minute. Horizontal axis displays the 24 h time with black bar indicates the sleep period.
- Citation: Bloomfield DA, Park A. Decoding white coat hypertension. World J Clin Cases 2017; 5(3): 82-92
- URL: https://www.wjgnet.com/2307-8960/full/v5/i3/82.htm
- DOI: https://dx.doi.org/10.12998/wjcc.v5.i3.82


