Copyright
©The Author(s) 2017.
World J Clin Cases. Mar 16, 2017; 5(3): 82-92
Published online Mar 16, 2017. doi: 10.12998/wjcc.v5.i3.82
Published online Mar 16, 2017. doi: 10.12998/wjcc.v5.i3.82
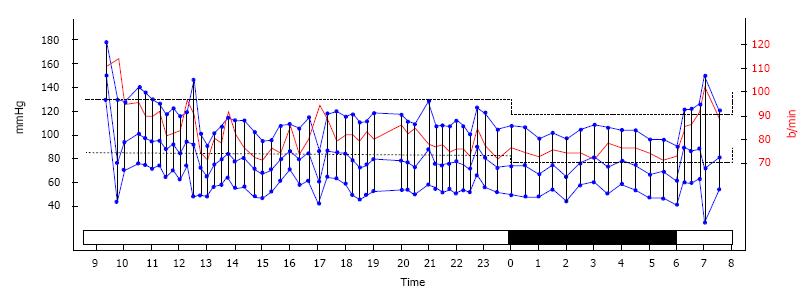
Figure 8 White coat hypertension with a blunted night time dip.
The recorded pressure in mmHg is noted on the left vertical axis. The pulse pressure in beats per minute is noted on the right vertical axis. The 24 h time of recording is noted on the horizontal axis. The solid black horizontal bar represents the sleep period.
- Citation: Bloomfield DA, Park A. Decoding white coat hypertension. World J Clin Cases 2017; 5(3): 82-92
- URL: https://www.wjgnet.com/2307-8960/full/v5/i3/82.htm
- DOI: https://dx.doi.org/10.12998/wjcc.v5.i3.82


