Copyright
©The Author(s) 2017.
World J Clin Cases. Jan 16, 2017; 5(1): 1-8
Published online Jan 16, 2017. doi: 10.12998/wjcc.v5.i1.1
Published online Jan 16, 2017. doi: 10.12998/wjcc.v5.i1.1
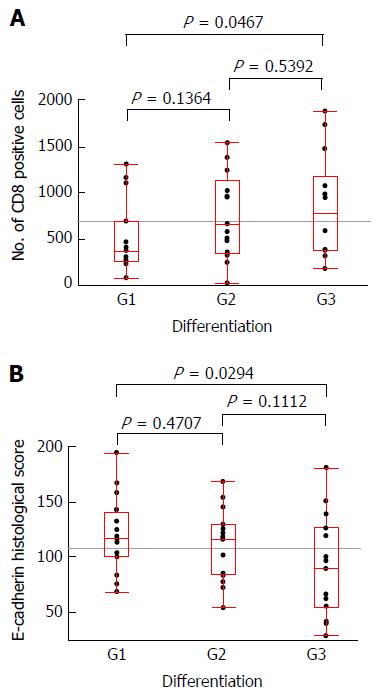
Figure 5 The box-and-whisker plots regarding pathologically assessed differentiation and the number of CD8+ cells (A) and the E-cadherin histological score (B).
Significant differences were observed in the comparison of G1 and G3 cases according to the number of CD8+ cells (P = 0.0467) and according to the E-cadherin histological score (P = 0.0294), respectively.
- Citation: Kai K, Masuda M, Aishima S. Inverse correlation between CD8+ inflammatory cells and E-cadherin expression in gallbladder cancer: Tissue microarray and imaging analysis. World J Clin Cases 2017; 5(1): 1-8
- URL: https://www.wjgnet.com/2307-8960/full/v5/i1/1.htm
- DOI: https://dx.doi.org/10.12998/wjcc.v5.i1.1


