Copyright
©The Author(s) 2015.
World J Clin Cases. Jun 16, 2015; 3(6): 519-524
Published online Jun 16, 2015. doi: 10.12998/wjcc.v3.i6.519
Published online Jun 16, 2015. doi: 10.12998/wjcc.v3.i6.519
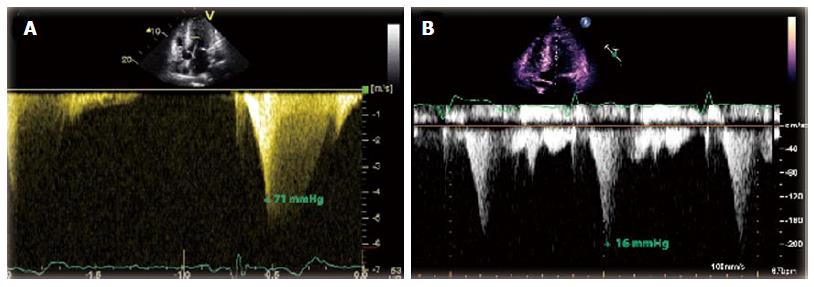
Figure 4 Transthoracic echocardiogram continuous Doppler.
A: Transthoracic echocardiogram continuous Doppler flow across the left ventricle. The mid-cavitary gradient at rest from two years prior to the left-ventricular apical aneurysm (LVAA) formation (71 mmHg) is shown; B: Over time, flow across the mid-cavitary obliteration decreased and the peak pressure declined after the formation of the LVAA (16 mmHg).
- Citation: Poulin MF, Shah A, Trohman RG, Madias C. Advanced Anderson-Fabry disease presenting with left ventricular apical aneurysm and ventricular tachycardia. World J Clin Cases 2015; 3(6): 519-524
- URL: https://www.wjgnet.com/2307-8960/full/v3/i6/519.htm
- DOI: https://dx.doi.org/10.12998/wjcc.v3.i6.519


