Copyright
©The Author(s) 2025.
World J Clin Cases. Jan 16, 2025; 13(2): 98319
Published online Jan 16, 2025. doi: 10.12998/wjcc.v13.i2.98319
Published online Jan 16, 2025. doi: 10.12998/wjcc.v13.i2.98319
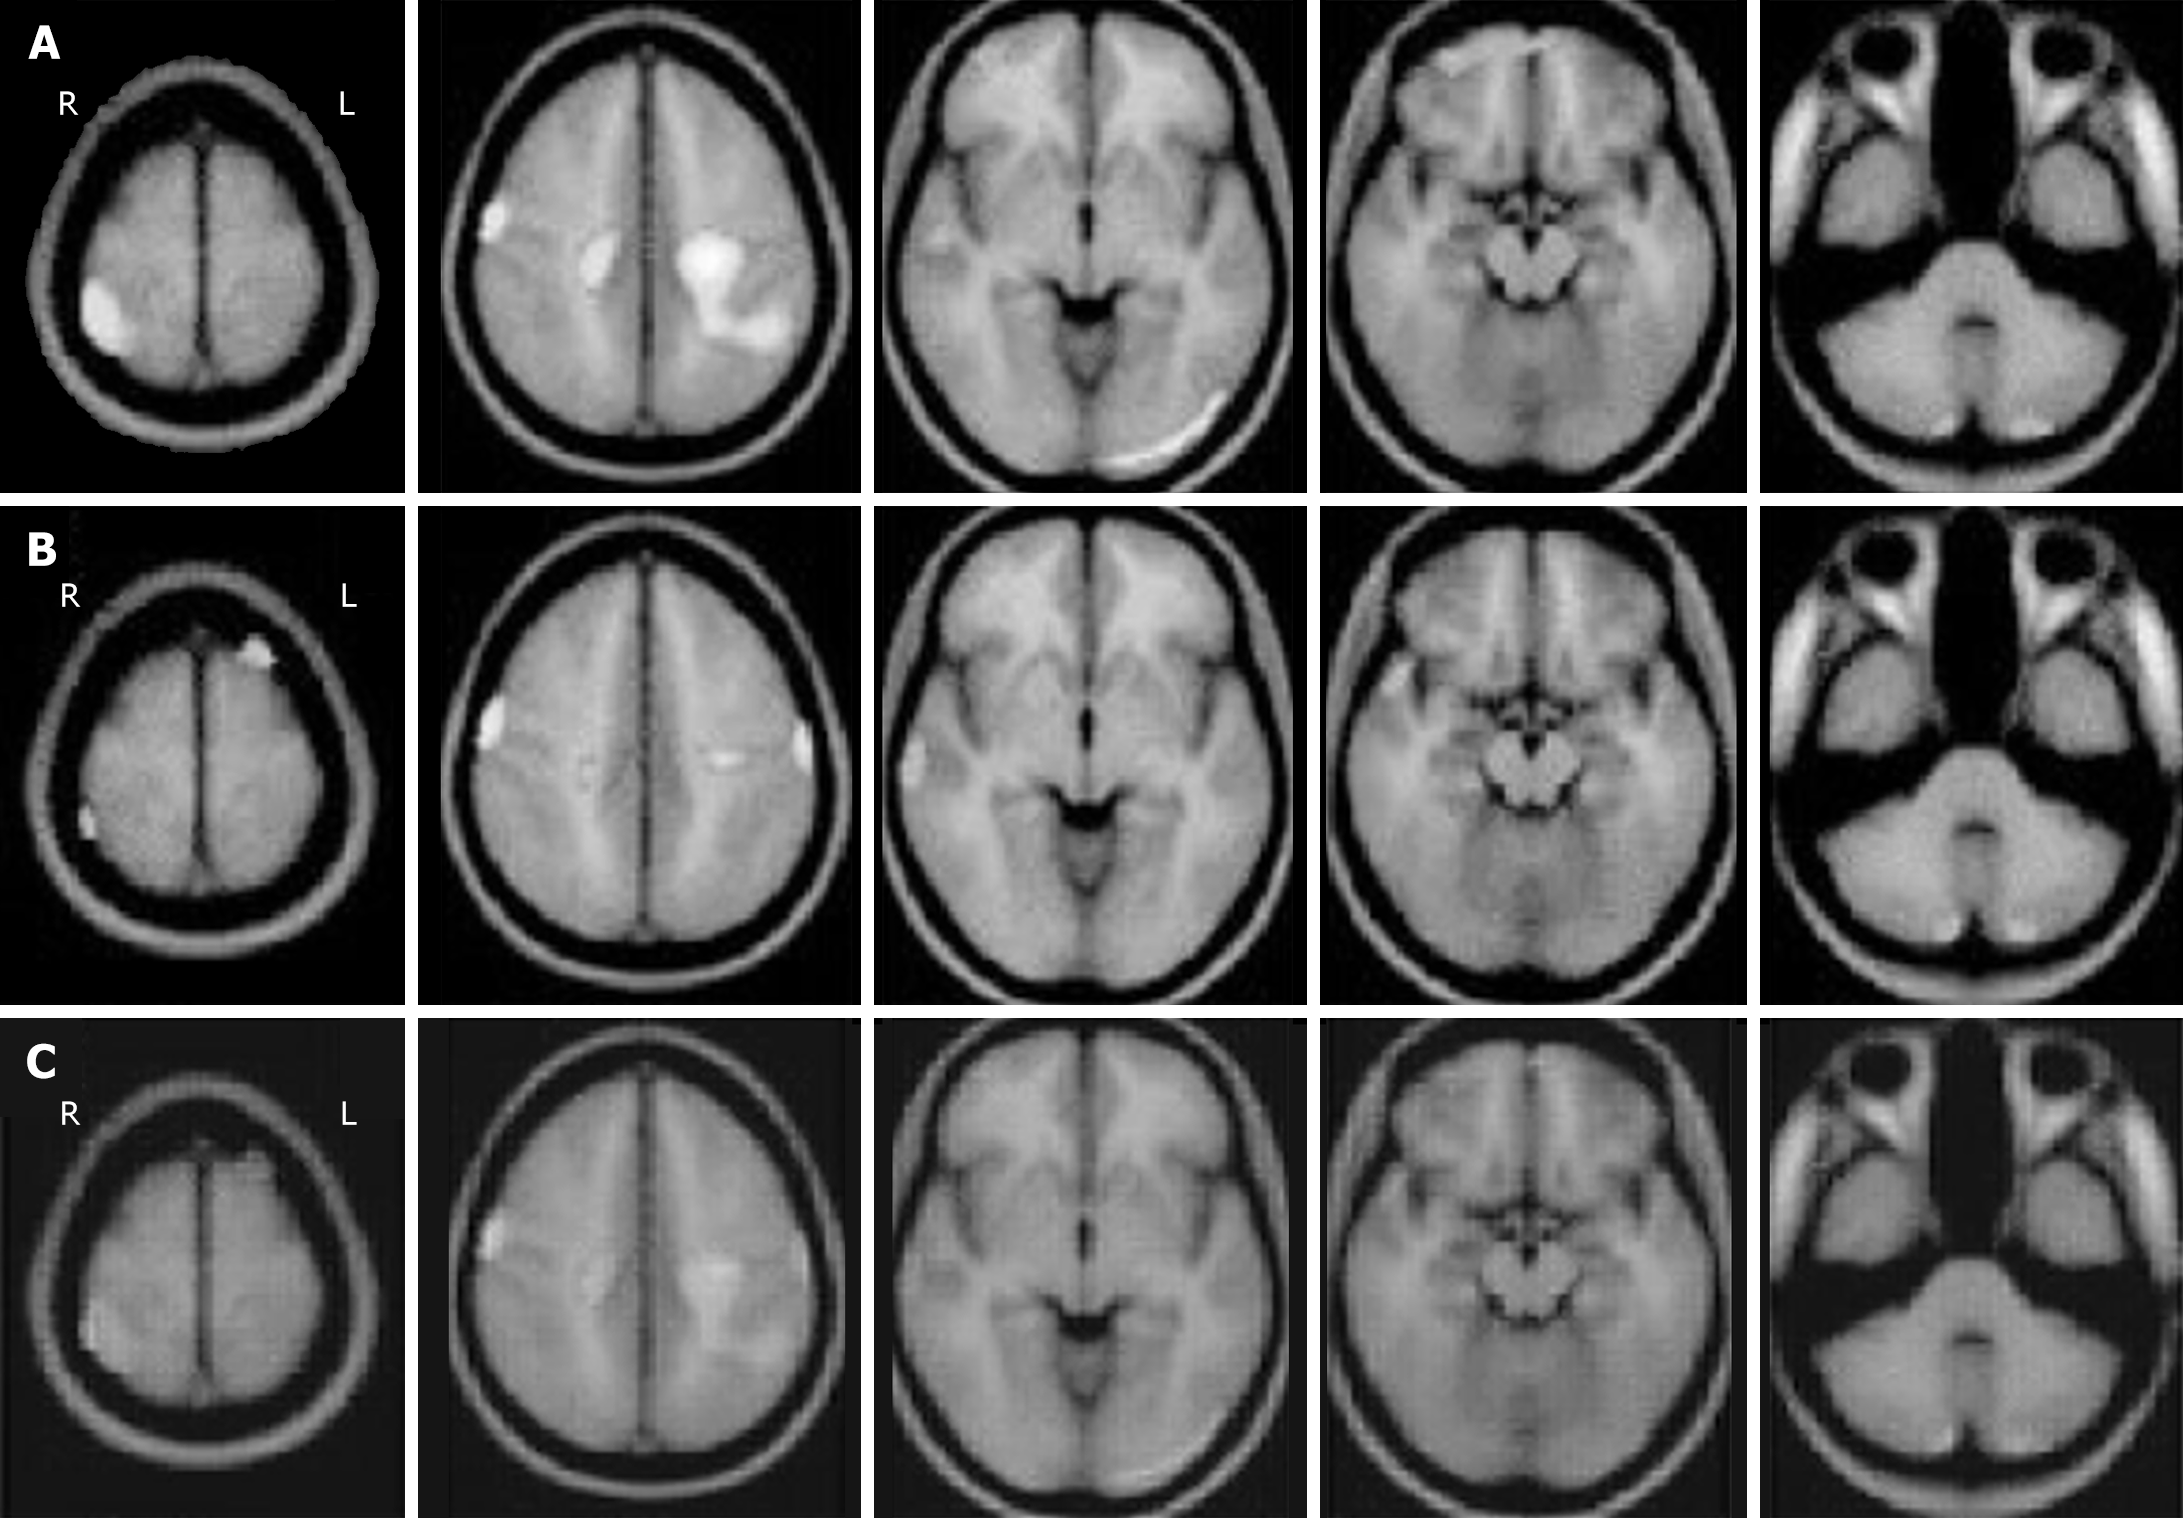
Figure 2 Magnetic resonance imaging of brain areas with cerebral blood flow in children with attention-deficit/hyperactivity disorder.
A and B: Lines of magnetic resonance imaging with gray level was applied to represent distinct baselines of cerebral blood flow at high or low density; C: Wavelet fusion was used to display the different cerebral blood flow in the pooled image. R: Right; L: Left.
- Citation: Zhu W. Magnetic resonance imaging evaluation and nuclear receptor binding SET domain protein 1 mutation in the Sotos syndrome with attention-deficit/hyperactivity disorder. World J Clin Cases 2025; 13(2): 98319
- URL: https://www.wjgnet.com/2307-8960/full/v13/i2/98319.htm
- DOI: https://dx.doi.org/10.12998/wjcc.v13.i2.98319


