Copyright
©The Author(s) 2025.
World J Clin Cases. Jun 6, 2025; 13(16): 102740
Published online Jun 6, 2025. doi: 10.12998/wjcc.v13.i16.102740
Published online Jun 6, 2025. doi: 10.12998/wjcc.v13.i16.102740
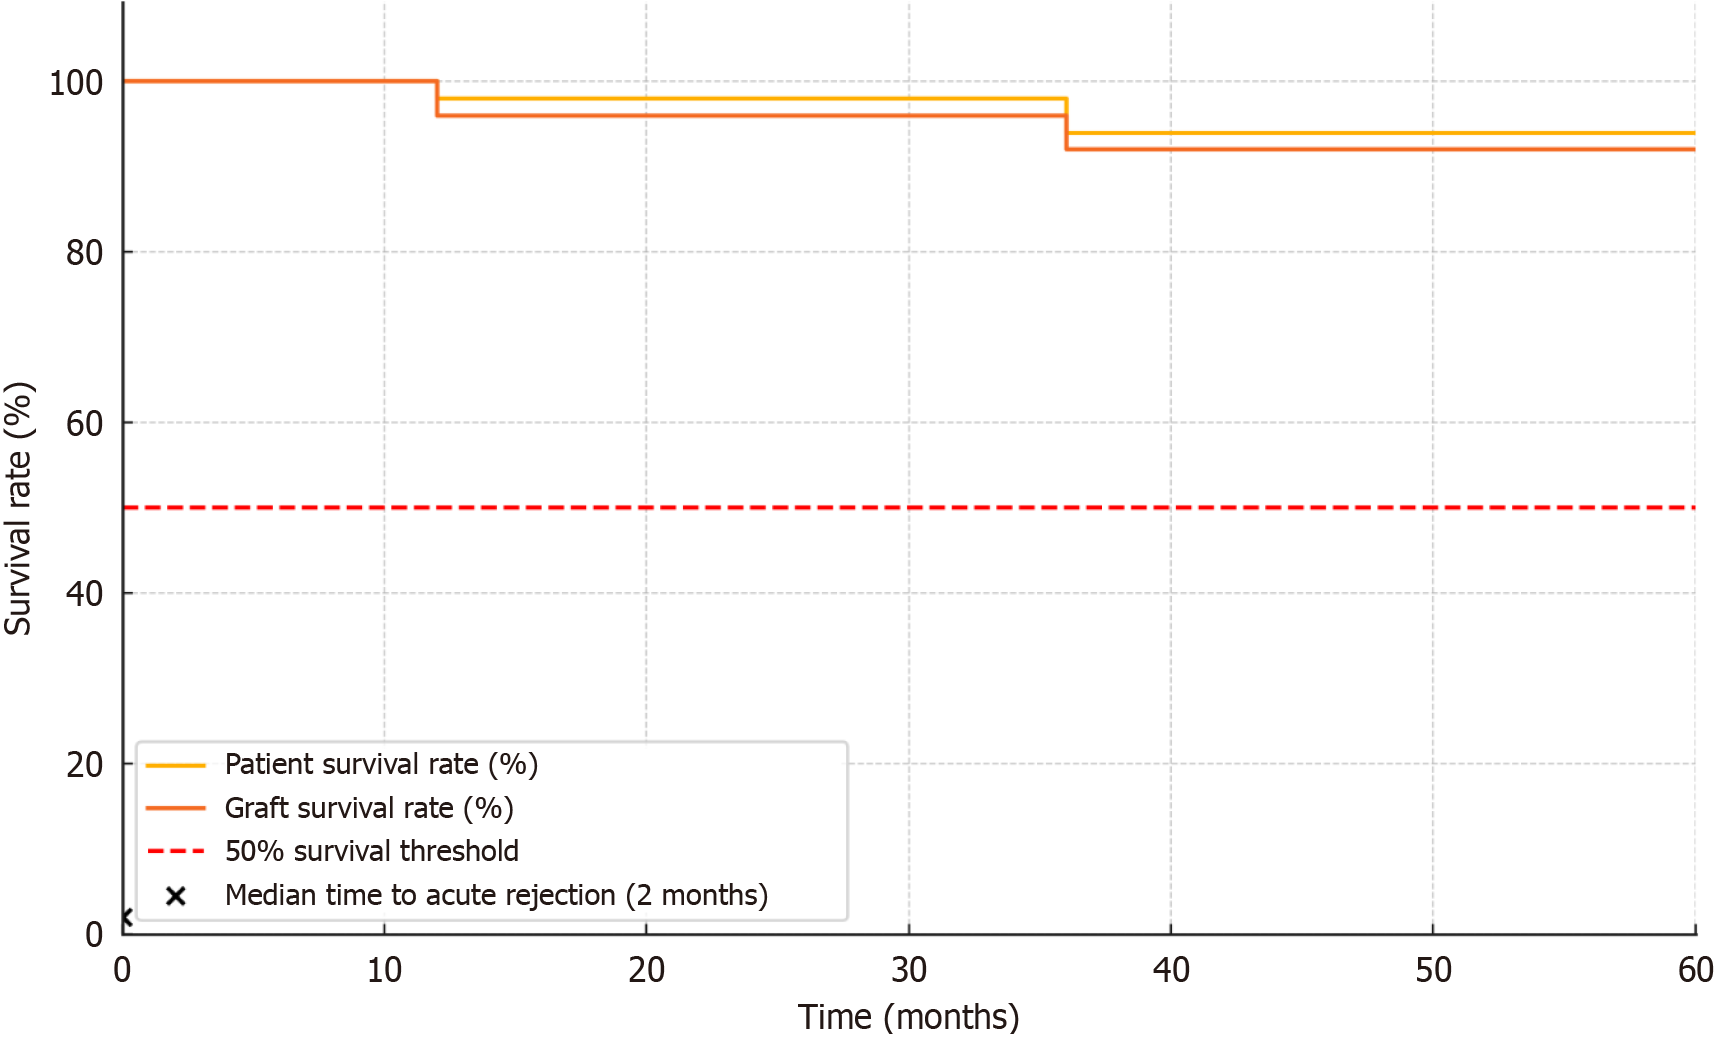
Figure 1 The Kaplan-Meier survival plot demonstrated the patient and graft survival rates over a 60-month follow-up period.
Patient survival rate gradually declined to 94% by month 60, indicating excellent long-term patient outcomes. Graft survival rate decreased to 92% by month 60, reflecting sustained graft viability. Median time-to-acute rejection was highlighted at 2 months, indicating the point where 50% of acute rejection events are expected to occur. This is shown as a black marker for emphasis. The red dashed line represents the 50% survival threshold, providing a clear visual reference point for comparison. This figure underscores the overall strong survival trends and the critical early period for monitoring acute rejection.
- Citation: Huseynov A, Kuşlu Çicek SN, Tuncer M. Advantages of the single-center model in domino transplant processes: Operational planning and management experience. World J Clin Cases 2025; 13(16): 102740
- URL: https://www.wjgnet.com/2307-8960/full/v13/i16/102740.htm
- DOI: https://dx.doi.org/10.12998/wjcc.v13.i16.102740


