Copyright
©The Author(s) 2024.
World J Clin Cases. Mar 26, 2024; 12(9): 1622-1633
Published online Mar 26, 2024. doi: 10.12998/wjcc.v12.i9.1622
Published online Mar 26, 2024. doi: 10.12998/wjcc.v12.i9.1622
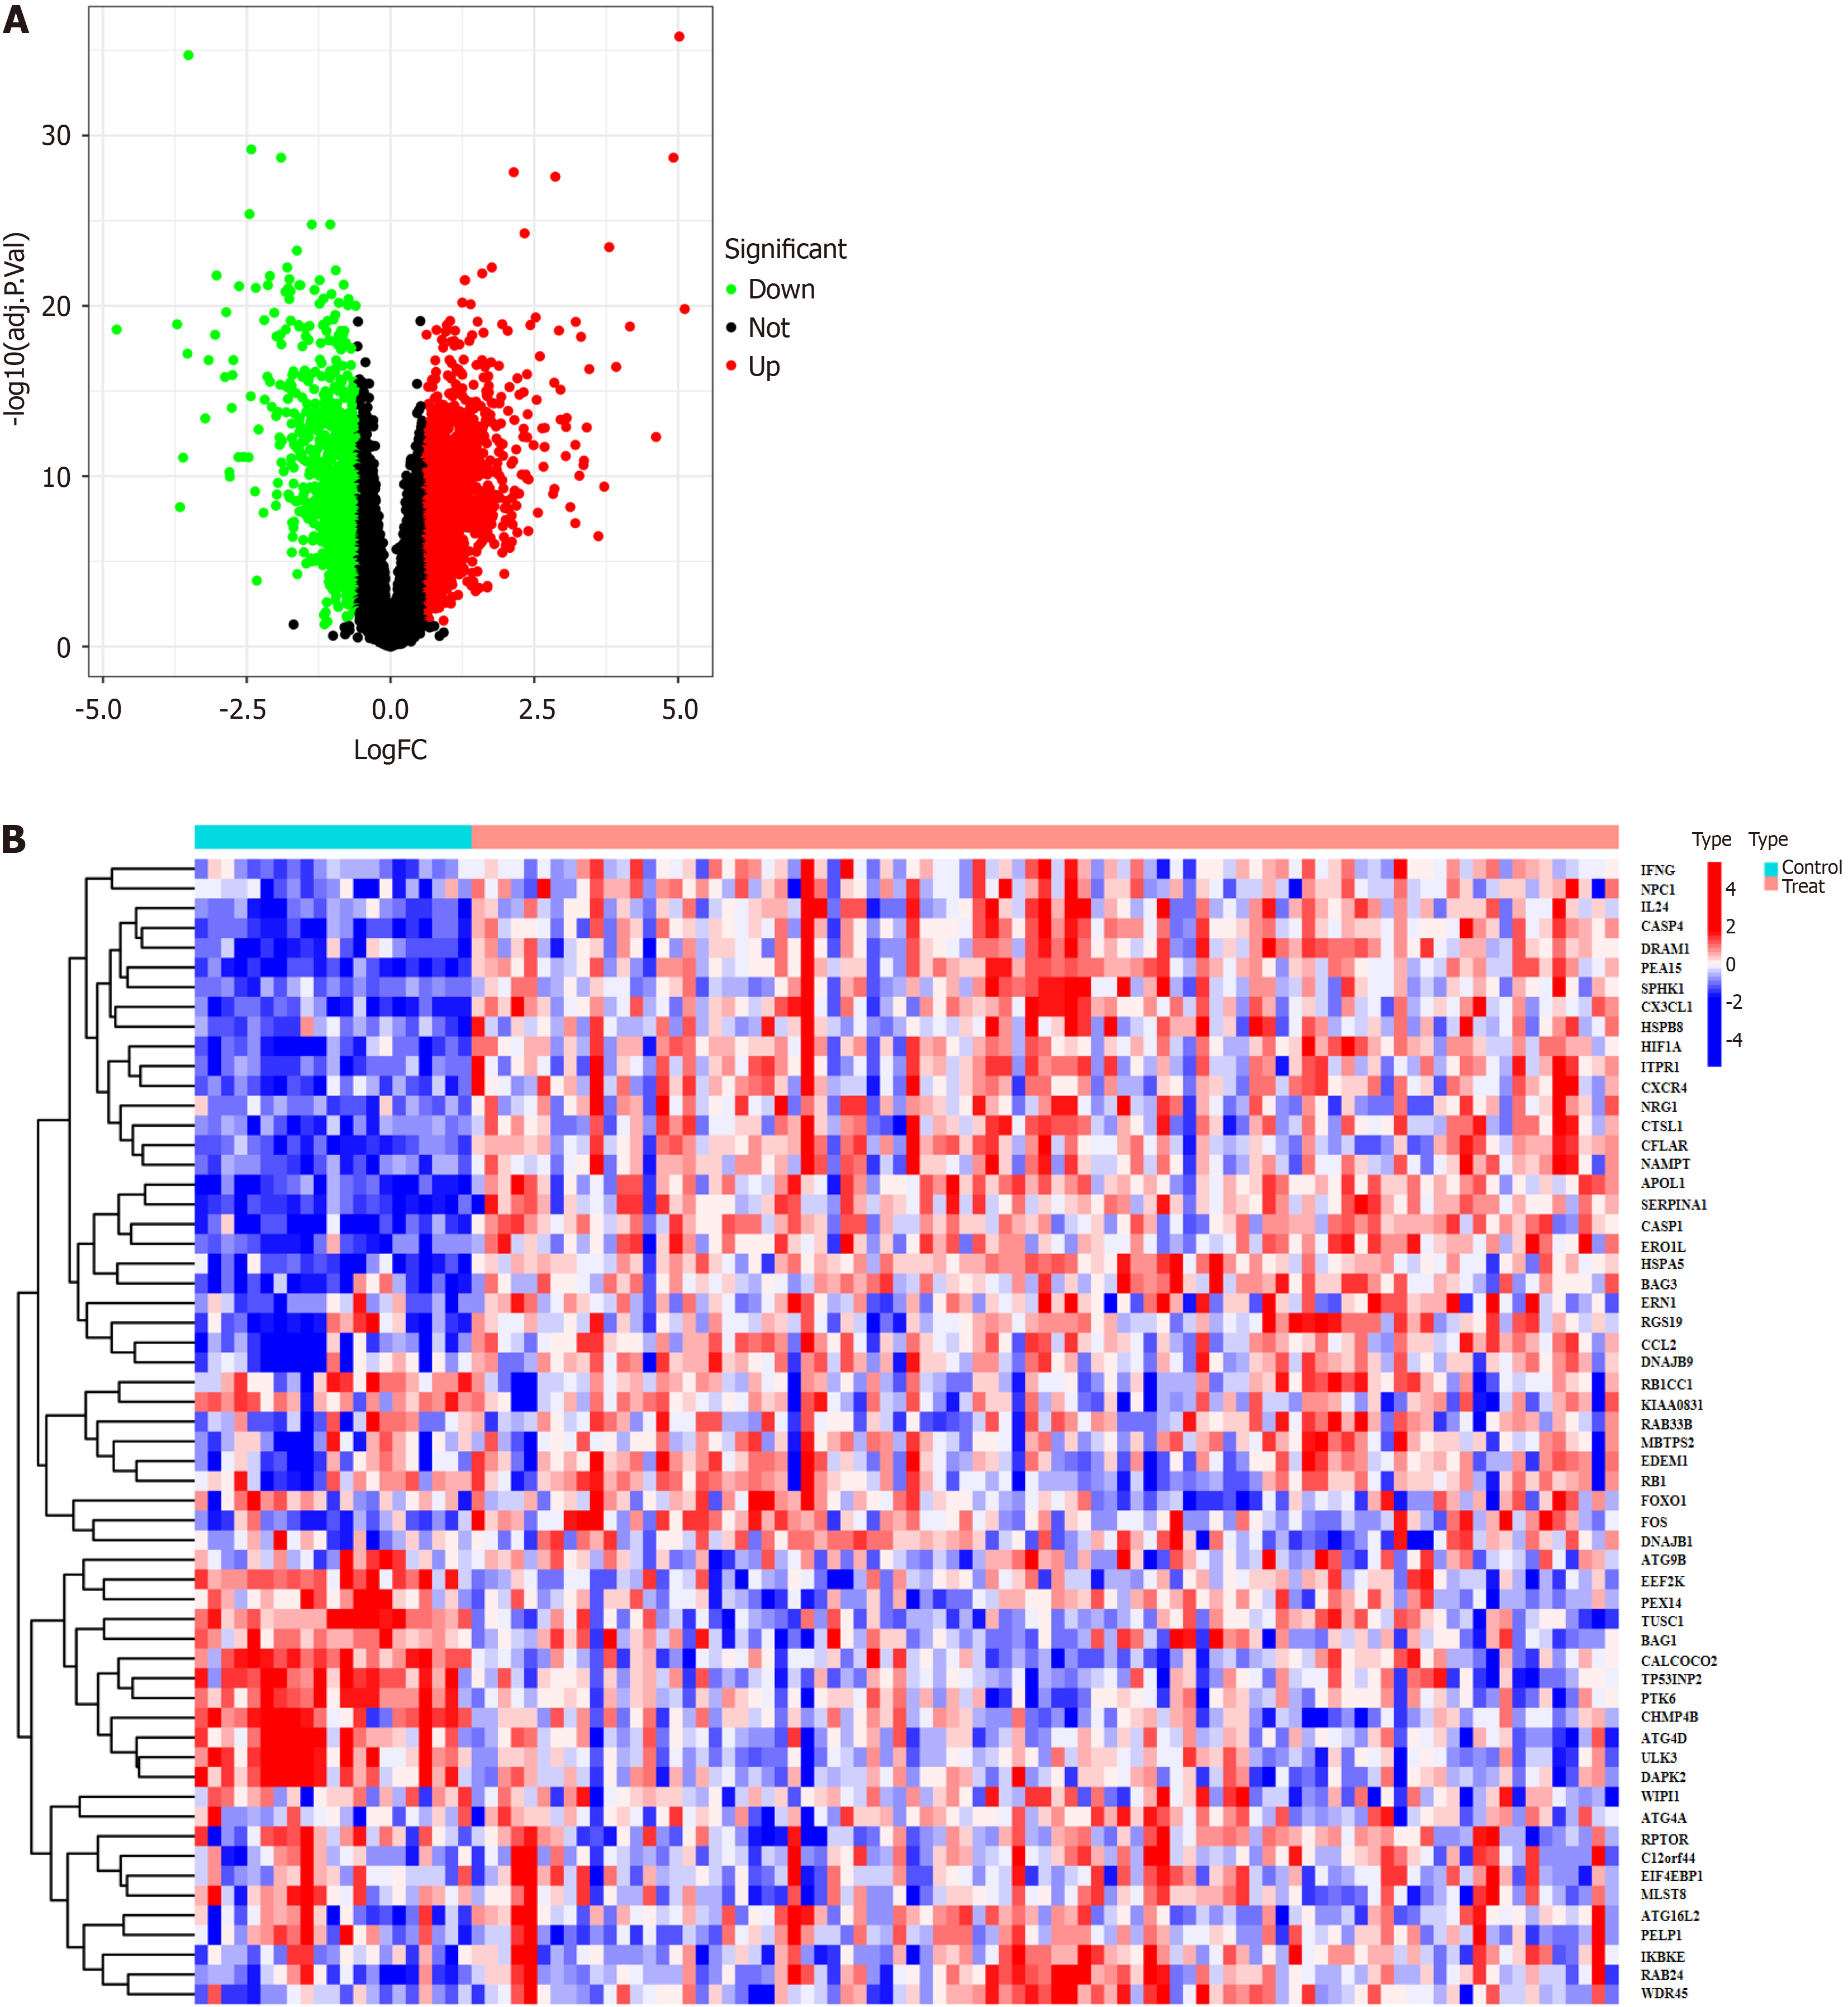
Figure 3 Volcano map and heat map showing expression of the differentially expressed autophagy-related genes.
A: The downregulated targets are represented by green dots, the upregulated targets are represented by red dots, and the black dots indicate no significant difference in expression between active ulcerative colitis patients and healthy controls. Heat map showing expression of the differentially expressed autophagy-related genes; B: The blue color indicates low expression, while the red color indicates high expression.
- Citation: Gong ZZ, Li T, Yan H, Xu MH, Lian Y, Yang YX, Wei W, Liu T. Exploring the autophagy-related pathogenesis of active ulcerative colitis. World J Clin Cases 2024; 12(9): 1622-1633
- URL: https://www.wjgnet.com/2307-8960/full/v12/i9/1622.htm
- DOI: https://dx.doi.org/10.12998/wjcc.v12.i9.1622


