Copyright
©The Author(s) 2024.
World J Clin Cases. Mar 16, 2024; 12(8): 1395-1405
Published online Mar 16, 2024. doi: 10.12998/wjcc.v12.i8.1395
Published online Mar 16, 2024. doi: 10.12998/wjcc.v12.i8.1395
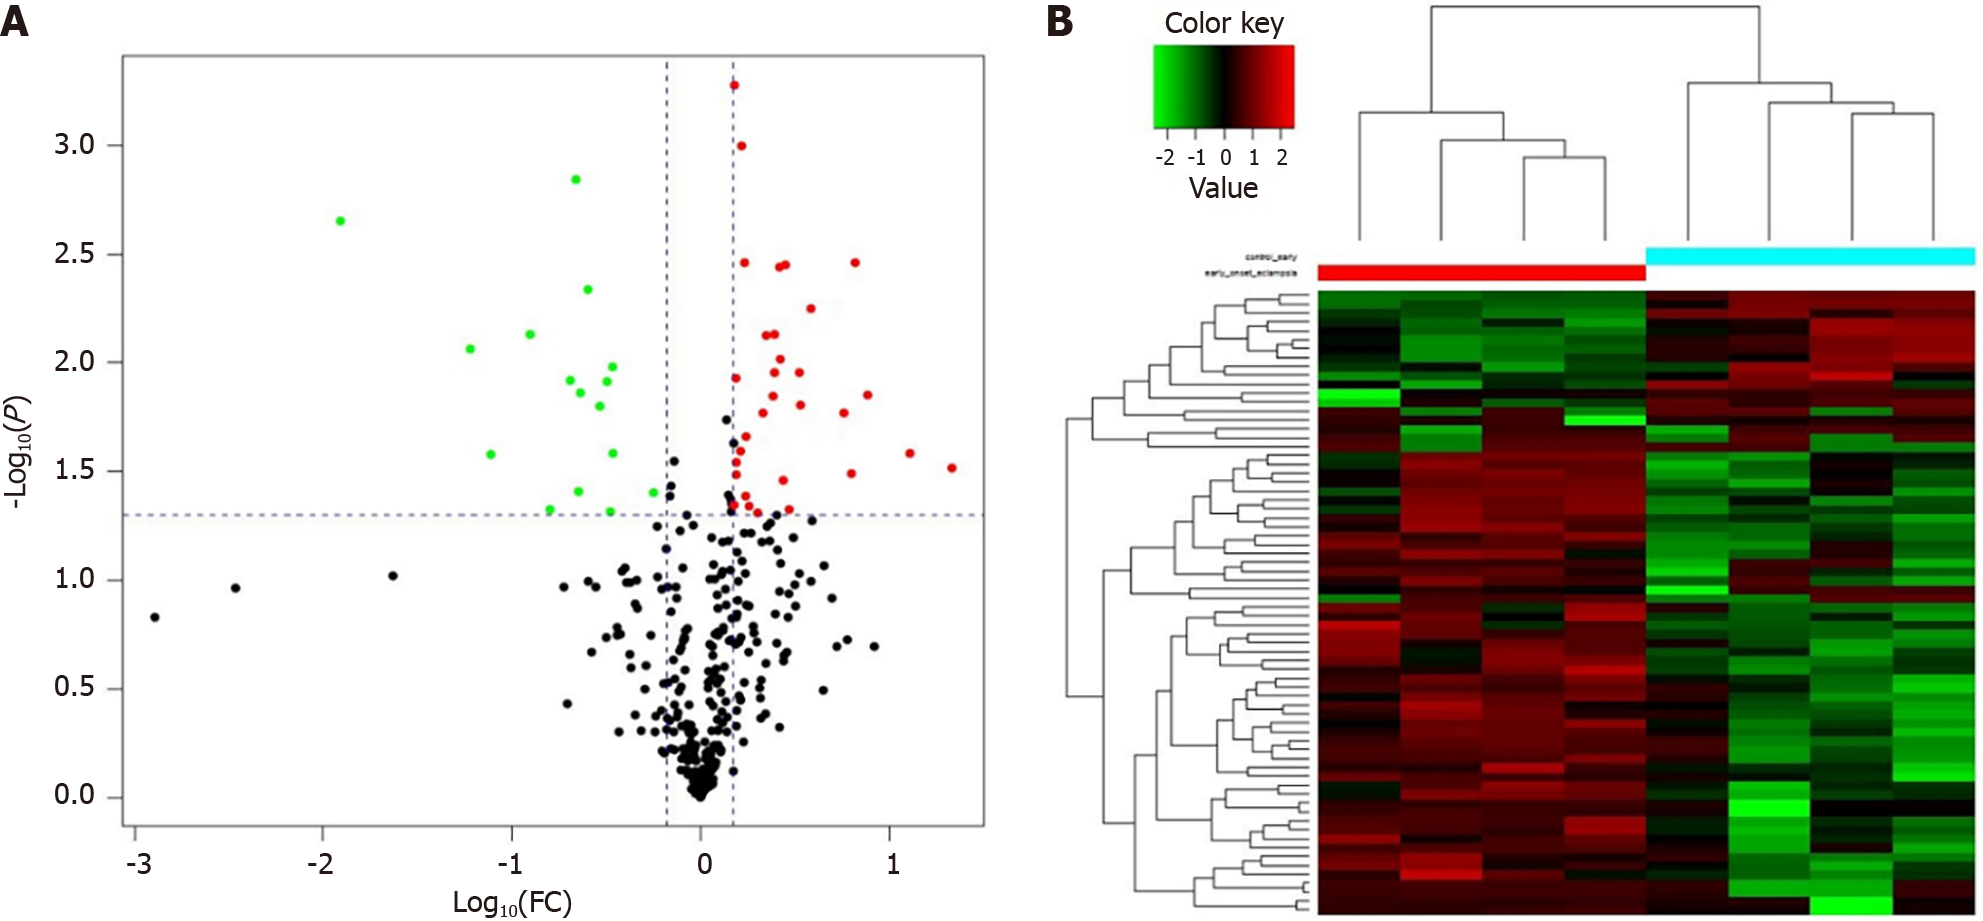
Figure 3 Differential protein expression.
A: Volcano plots with red dots on the right-hand side indicating upregulation, green dots on the left-hand side indicating downregulation, and black dots indicating no significant change in protein expression levels based on the criteria of an absolute log10 fold change (FC; i.e., > 1.2 difference) and P < 0.05 between gestational diabetes mellitus and its control group; B: Clustergram for the expression of the differentially expressed proteins between gestational diabetes mellitus and control.
- Citation: Cao WL, Yu CP, Zhang LL. Serum proteins differentially expressed in gestational diabetes mellitus assessed using isobaric tag for relative and absolute quantitation proteomics. World J Clin Cases 2024; 12(8): 1395-1405
- URL: https://www.wjgnet.com/2307-8960/full/v12/i8/1395.htm
- DOI: https://dx.doi.org/10.12998/wjcc.v12.i8.1395


