Copyright
©The Author(s) 2024.
World J Clin Cases. Mar 6, 2024; 12(7): 1215-1226
Published online Mar 6, 2024. doi: 10.12998/wjcc.v12.i7.1215
Published online Mar 6, 2024. doi: 10.12998/wjcc.v12.i7.1215
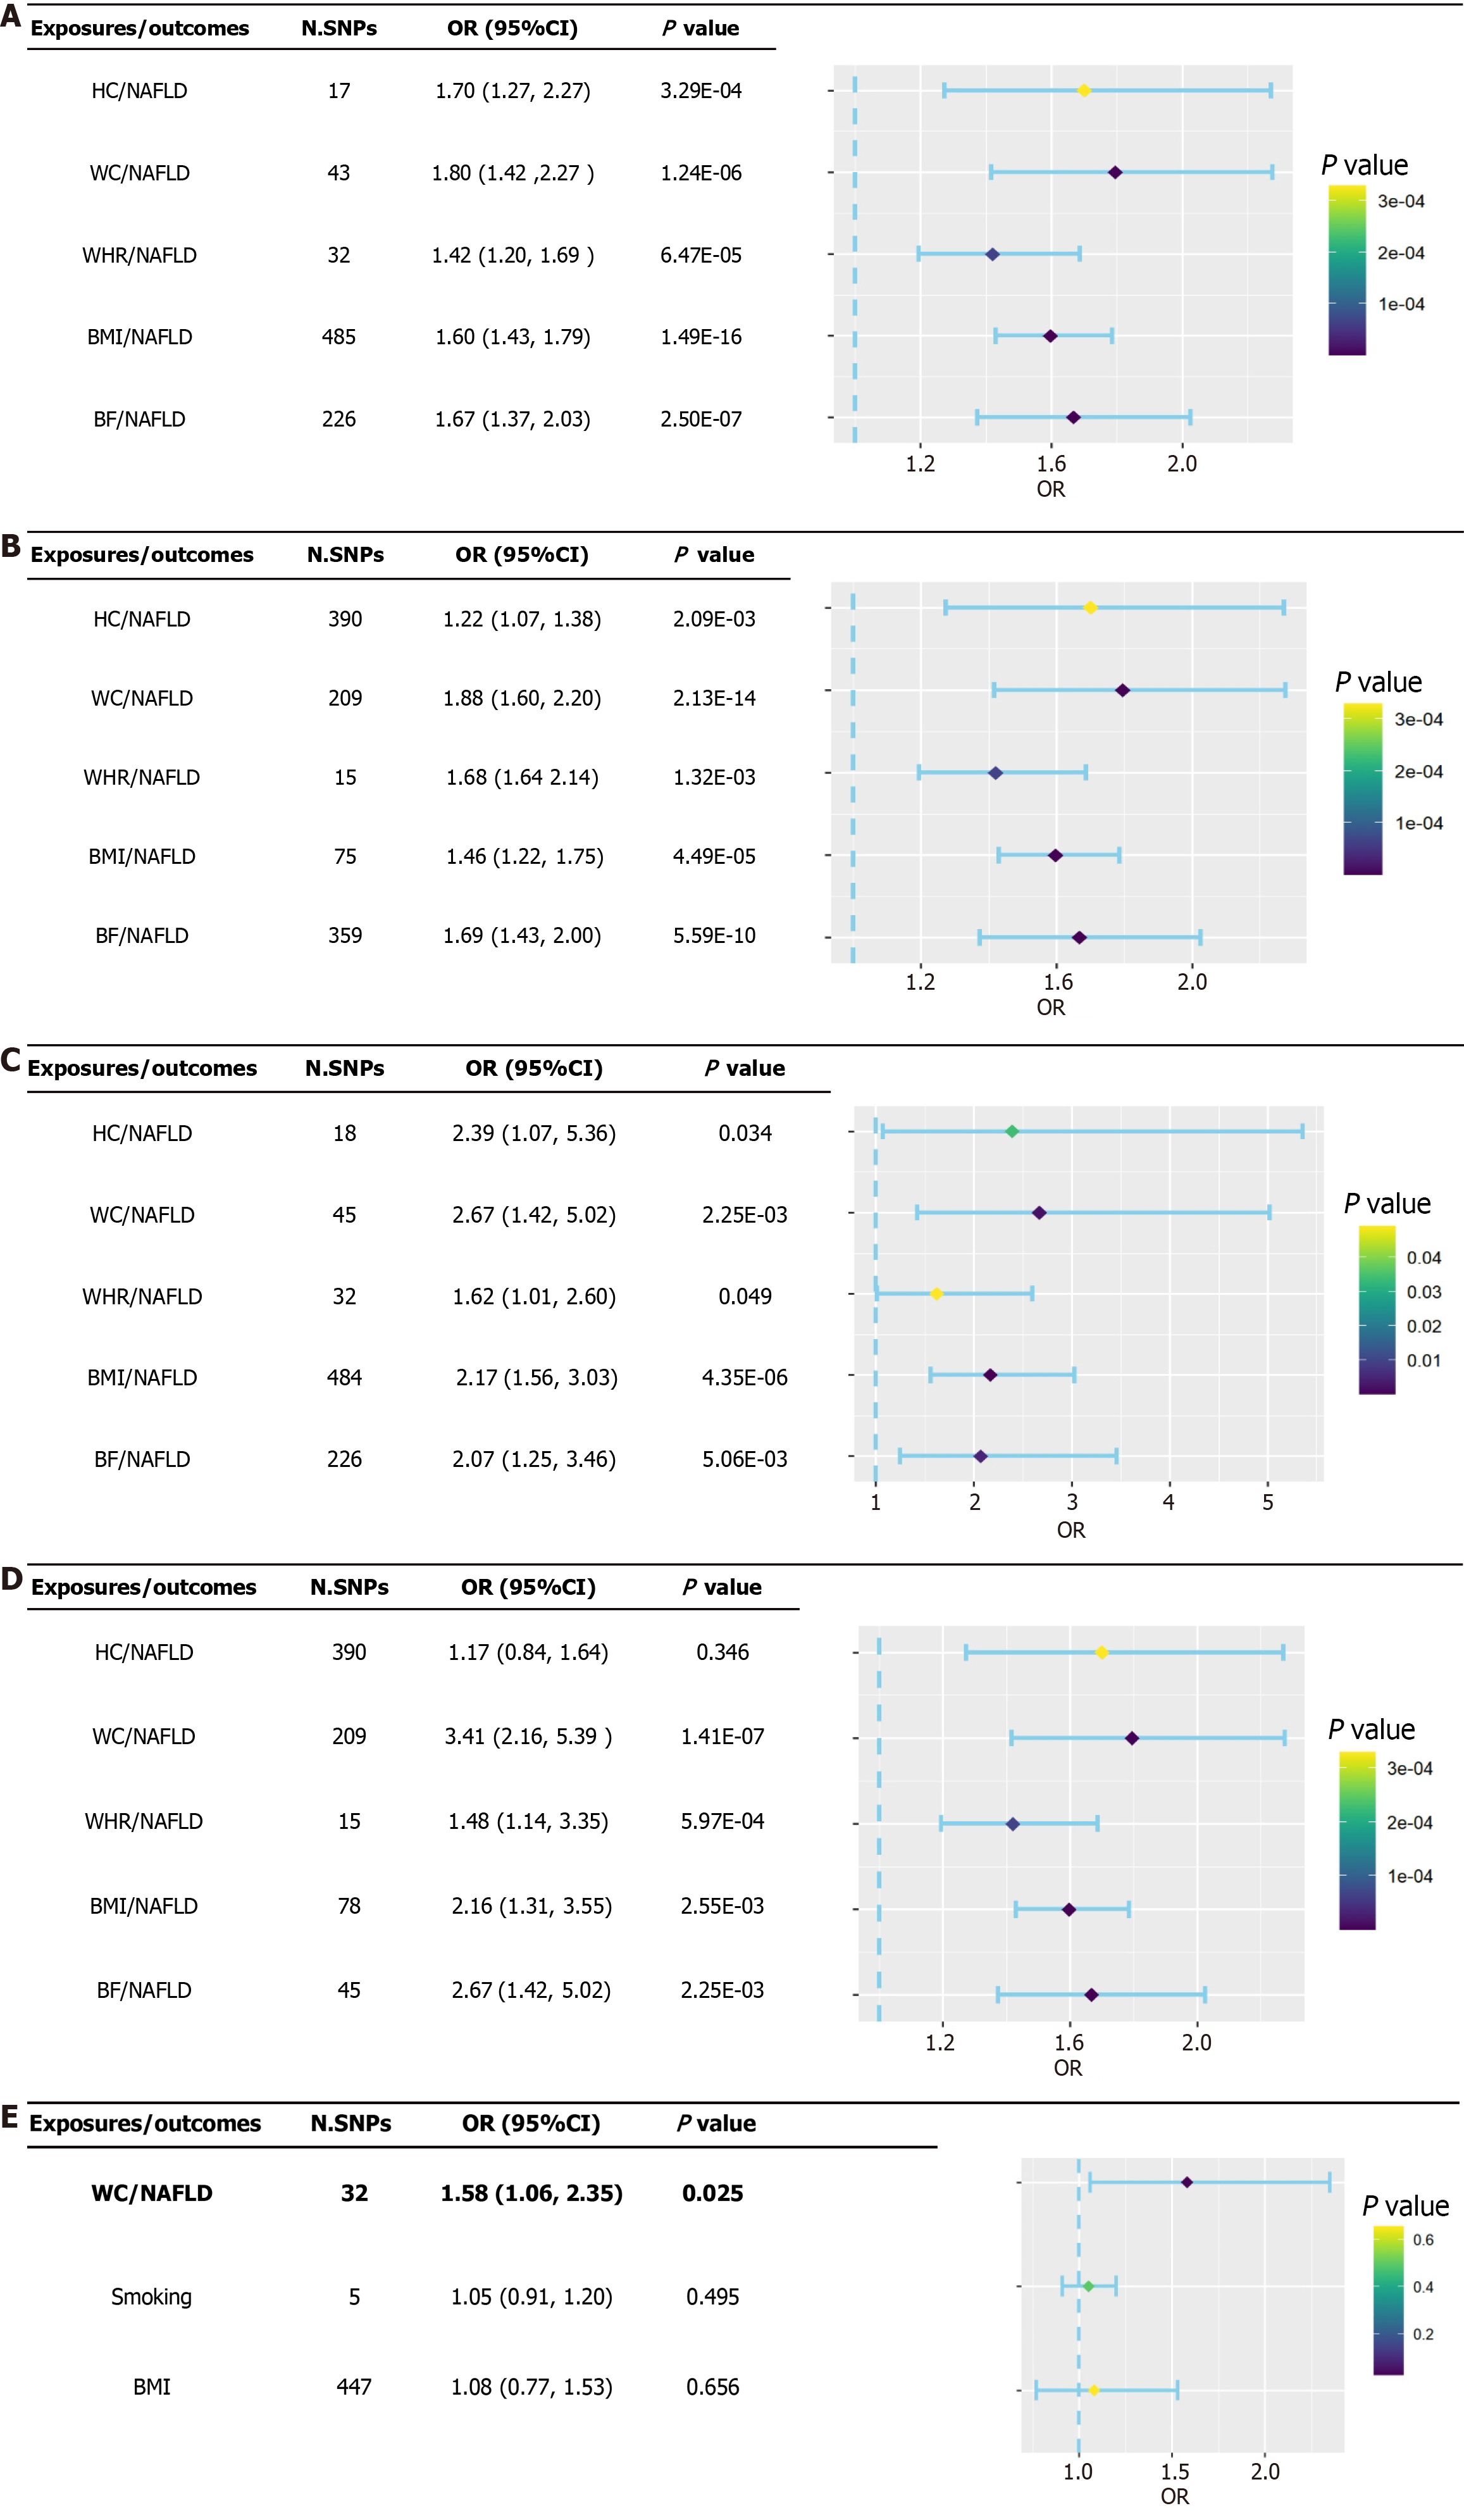
Figure 2 Forest plot of causal associations of anthropometric indicators on the risk of nonalcoholic fatty liver disease.
A: Forest plot of causal associations of anthropometric indicators (discovery dataset) on the risk of nonalcoholic fatty liver disease (NAFLD) (United Kingdom biobank); B: Forest plot of causal associations of anthropometric indicators (discovery dataset) on the risk of NAFLD (FinnGen); C: Forest plot of causal associations of anthropometric indicators (replication dataset) on the risk of NAFLD (United Kingdom biobank); D: Forest plot of causal associations of anthropometric indicators (replication dataset) on the risk of NAFLD (FinnGen); E: Causal associations of waist circumference on the risk of NAFLD after adjusting for body mass index and smoking. HC: Hip circumference; WC: Waist circumference; WHR: Waist-to-hip ratio; BMI: Body mass index; BF: Body fat percentage; NAFLD: Nonalcoholic fatty liver disease; SNPs: Single nucleotide polymorphisms; OR: Odds ratio.
- Citation: Xiao XP, Dai YJ, Zhang Y, Yang M, Xie J, Chen G, Yang ZJ. Investigating the causal associations between five anthropometric indicators and nonalcoholic fatty liver disease: Mendelian randomization study. World J Clin Cases 2024; 12(7): 1215-1226
- URL: https://www.wjgnet.com/2307-8960/full/v12/i7/1215.htm
- DOI: https://dx.doi.org/10.12998/wjcc.v12.i7.1215


