Copyright
©The Author(s) 2024.
World J Clin Cases. Feb 16, 2024; 12(5): 951-965
Published online Feb 16, 2024. doi: 10.12998/wjcc.v12.i5.951
Published online Feb 16, 2024. doi: 10.12998/wjcc.v12.i5.951
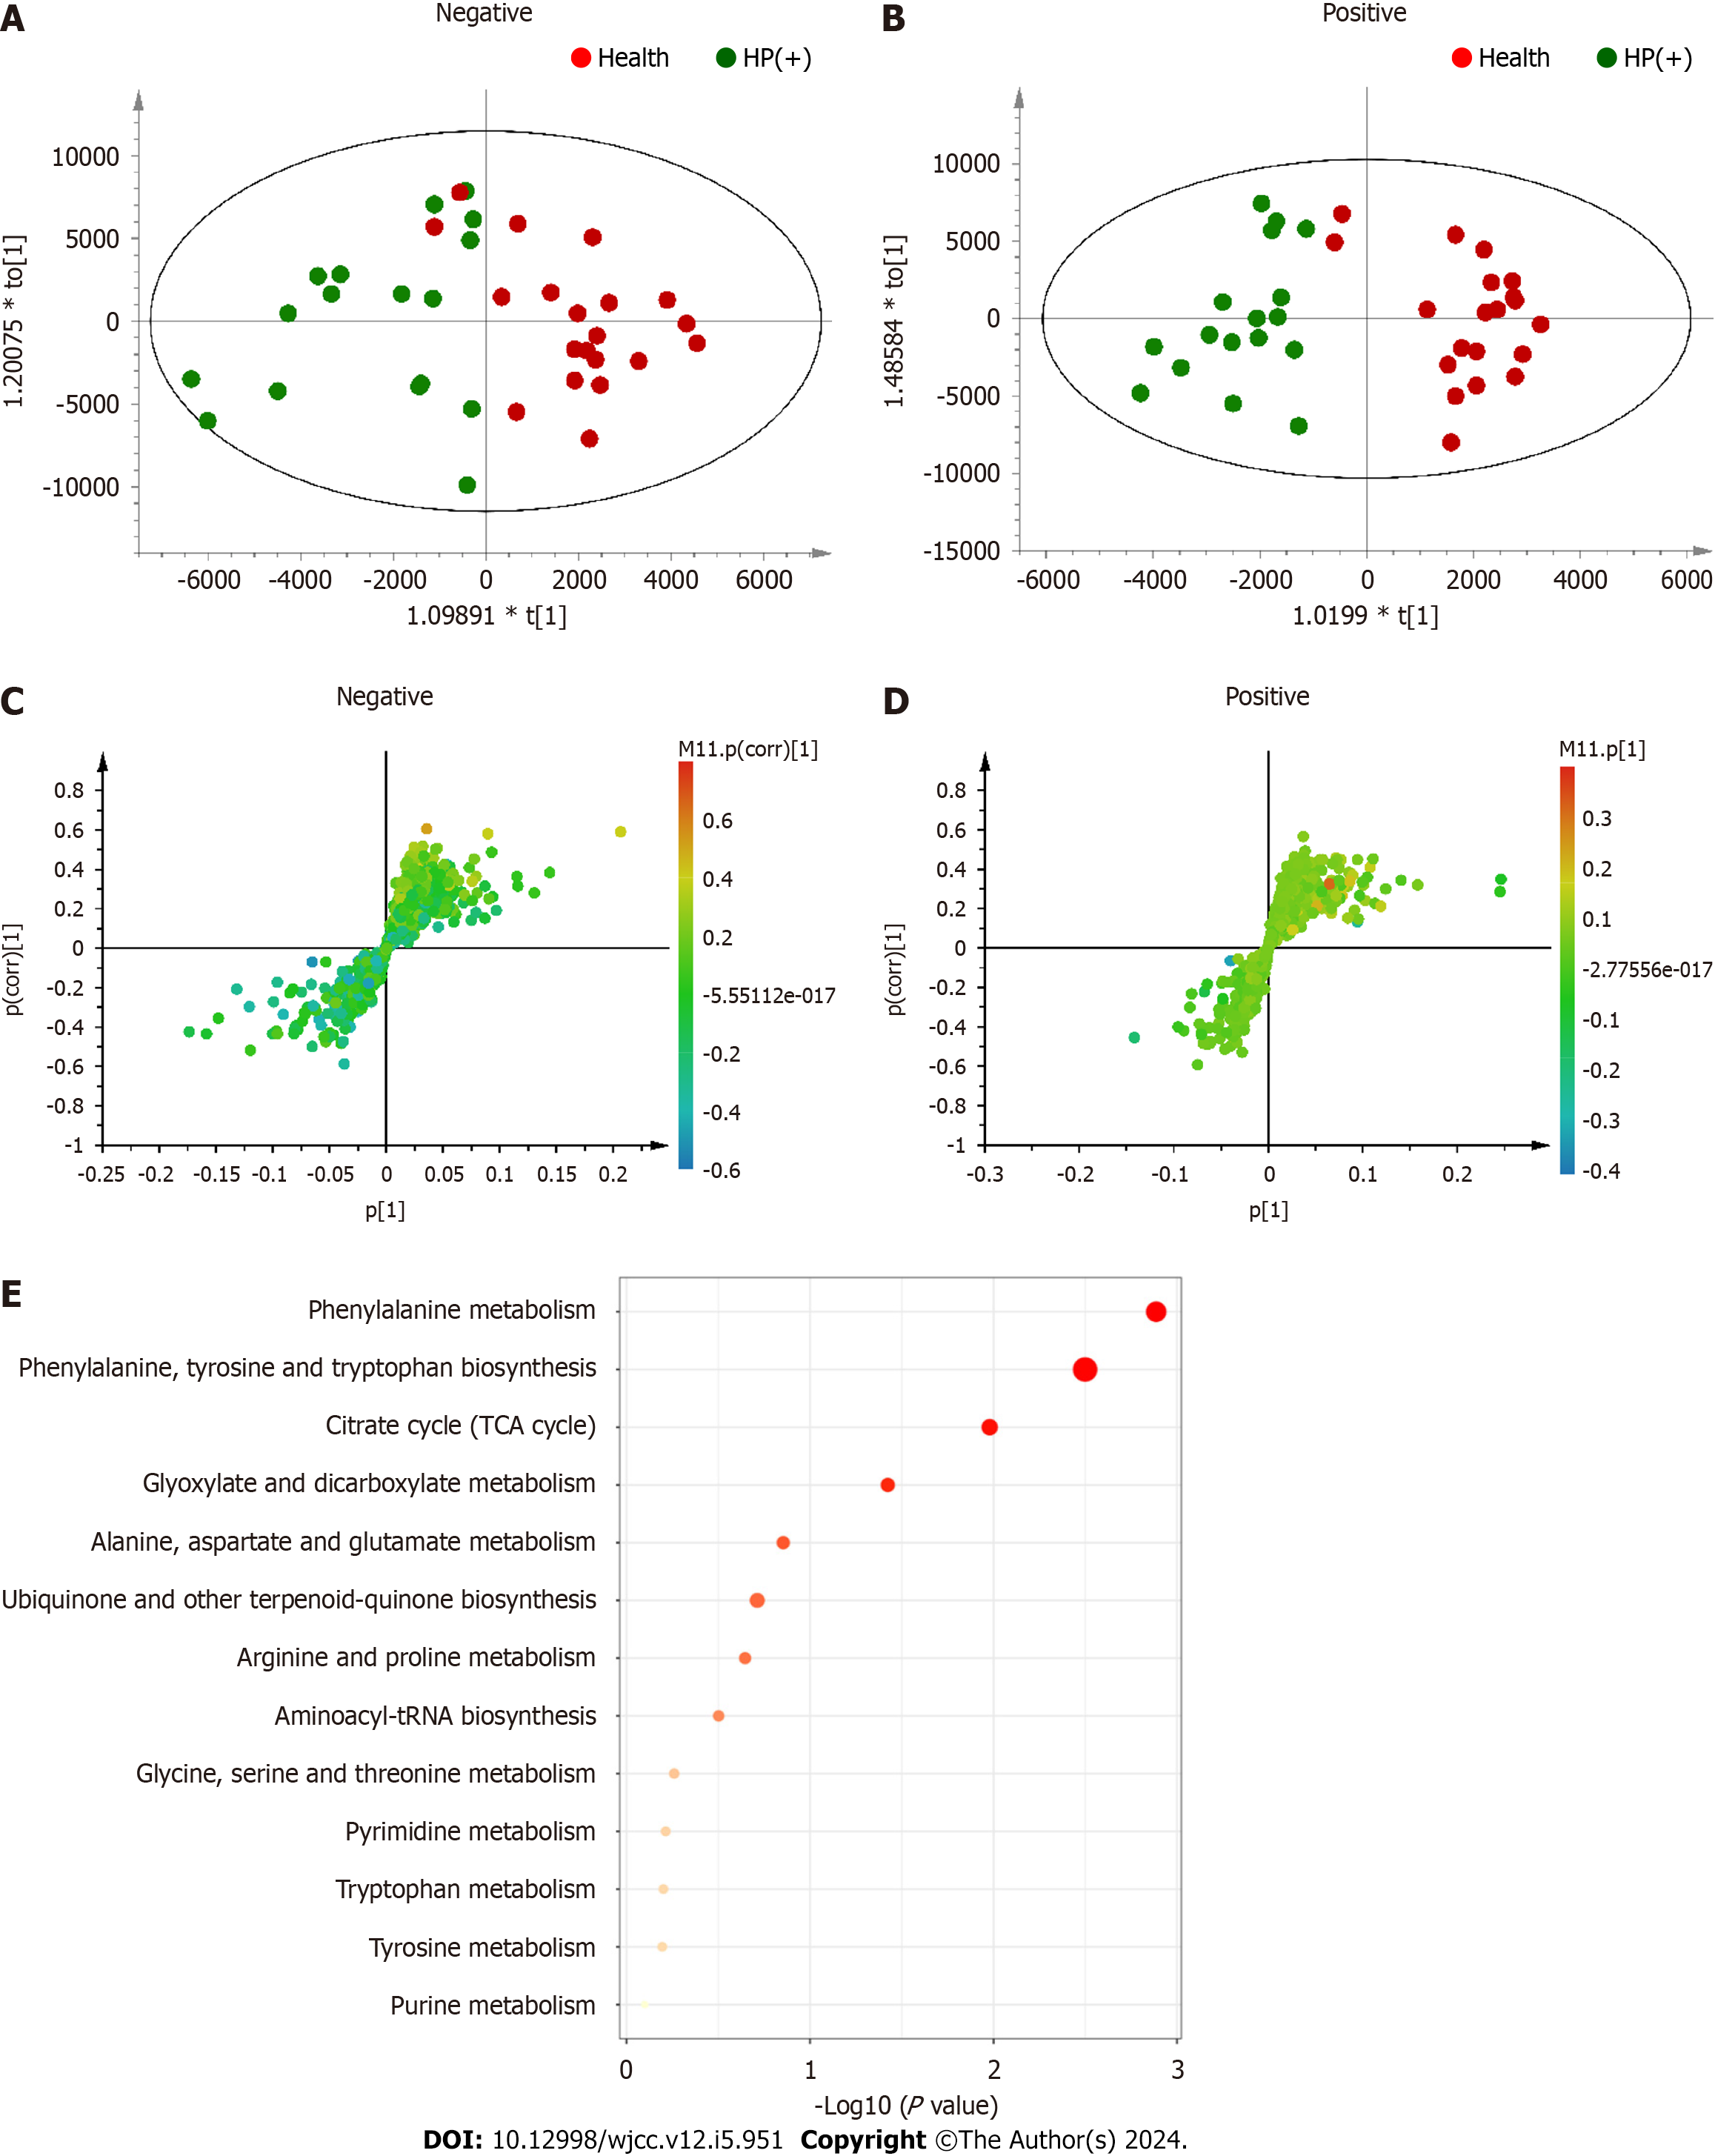
Figure 3 Orthogonal partial least square discriminant analysis and pathway enrichment analysis of the health and Helicobacter pylori-positive samples.
A, B: Orthogonal partial least square (OPLS) score plots; C, D: S-plots; A, C: Negative electronspray ionization (ESI) mode; B, D: Positive ESI mode. Model parameters of the negative ESI mode: R2X = 0.537, R2Y = 0.935, and Q2 = −0.33. Model parameters of the positive ESI mode: R2X = 0.467, R2Y = 0.955, and Q2 = −0.0553; E: Pathway enrichment analysis of differential metabolites between Helicobacter pylori-negative and health samples. Differential metabolites were obtained from OPLS–discriminant analysis and subjected to Kyoto encyclopedia of genes and genomes analysis using MetaboAnalyst software. Helicobacter pylori-positive; HP(−): Helicobacter pylori-negative.
- Citation: An WT, Hao YX, Li HX, Wu XK. Urinary metabolic profiles during Helicobacter pylori eradication in chronic gastritis. World J Clin Cases 2024; 12(5): 951-965
- URL: https://www.wjgnet.com/2307-8960/full/v12/i5/951.htm
- DOI: https://dx.doi.org/10.12998/wjcc.v12.i5.951


