Copyright
©The Author(s) 2024.
World J Clin Cases. Feb 6, 2024; 12(4): 700-720
Published online Feb 6, 2024. doi: 10.12998/wjcc.v12.i4.700
Published online Feb 6, 2024. doi: 10.12998/wjcc.v12.i4.700
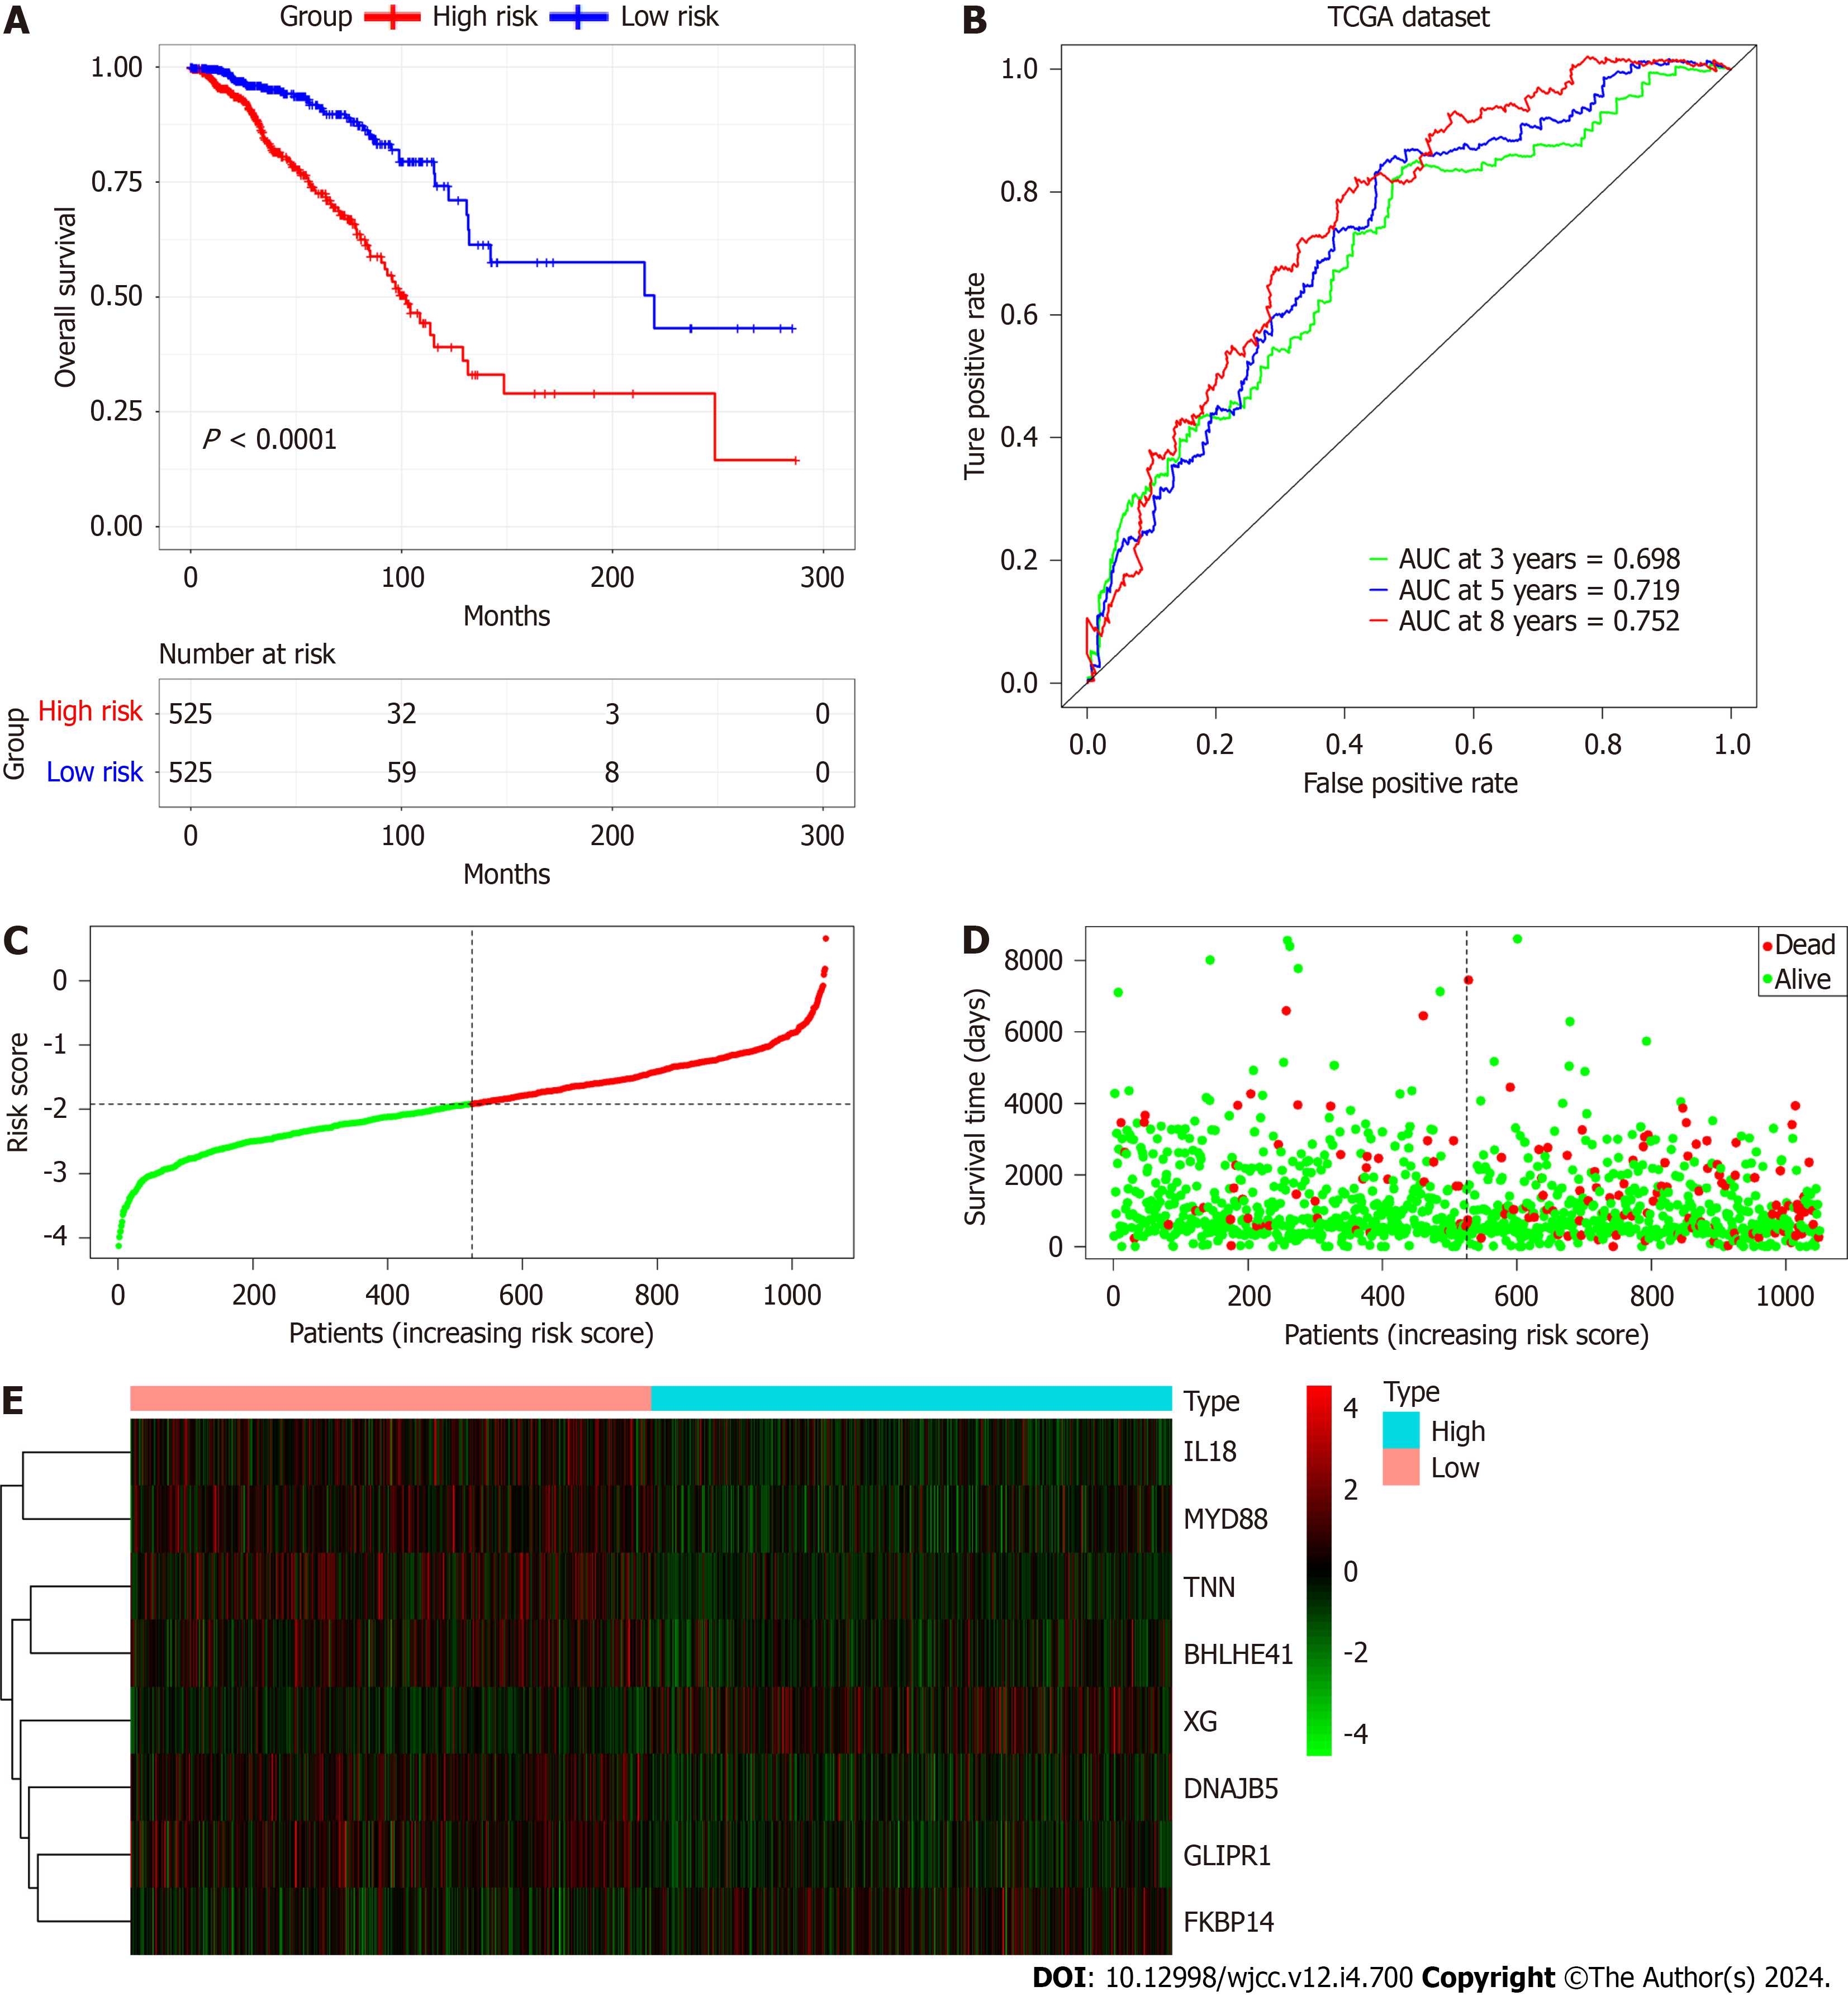
Figure 7 Evaluation of the prognostic signature using the The Cancer Genome Atlas database.
A: Kaplan-Meier plots of overall survival between the high- and low-risk cohorts; B: Time-dependent receiver operating characteristic curve analysis; C: Risk score distribution; D: Survival distribution; E: Expression heatmap of the 8 cancer associated fibroblast-associated risk genes.
- Citation: Wu ZZ, Wei YJ, Li T, Zheng J, Liu YF, Han M. Identification and validation of a new prognostic signature based on cancer-associated fibroblast-driven genes in breast cancer. World J Clin Cases 2024; 12(4): 700-720
- URL: https://www.wjgnet.com/2307-8960/full/v12/i4/700.htm
- DOI: https://dx.doi.org/10.12998/wjcc.v12.i4.700


