Copyright
©The Author(s) 2024.
World J Clin Cases. Feb 6, 2024; 12(4): 700-720
Published online Feb 6, 2024. doi: 10.12998/wjcc.v12.i4.700
Published online Feb 6, 2024. doi: 10.12998/wjcc.v12.i4.700
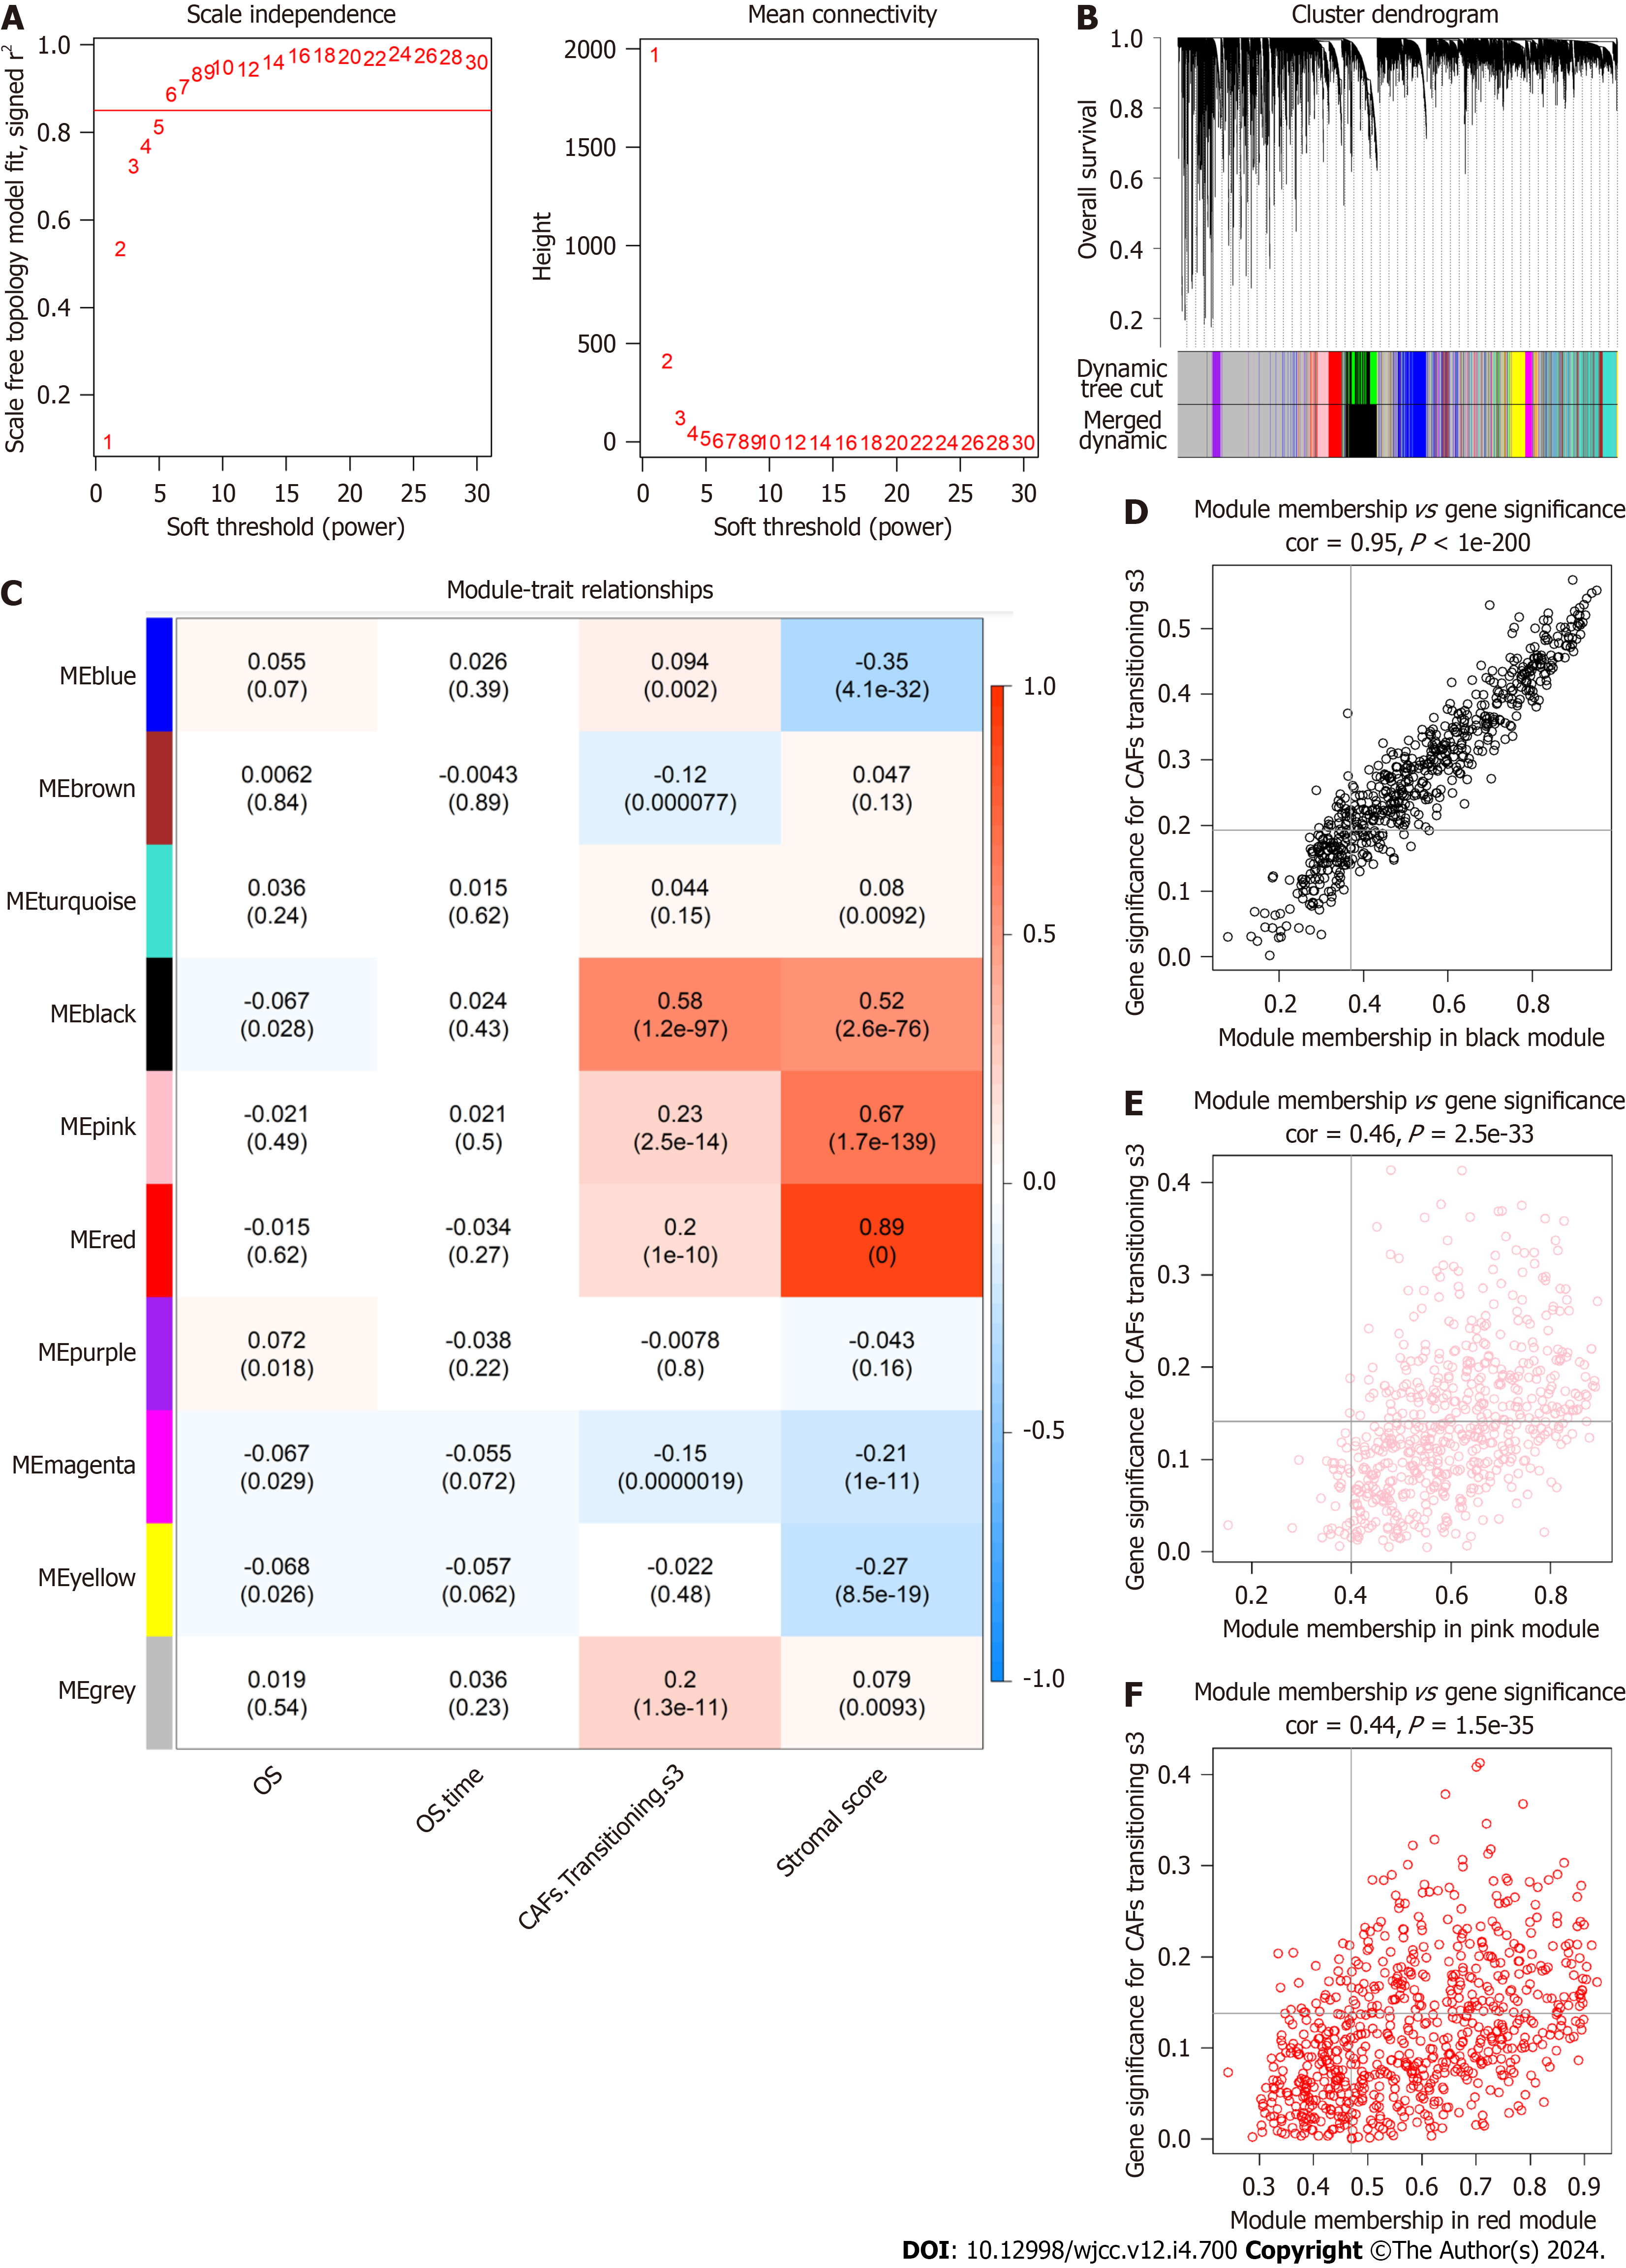
Figure 3 Co-expression pathways generated by weighted gene co-expression network analysis.
A: A soft-thresholding power (β) of 6 was chosen, following the scale-free topology criterion; B: Clustering dendrograms depicting genes with comparable expression signatures were grouped into co-expression modules; C: Module-trait associations illustrating the relationships between individual gene module eigengenes and matching phenotype; D-F: Scatter plots of the module membership and gene significance of individual genes in the black, pink, and red modules.
- Citation: Wu ZZ, Wei YJ, Li T, Zheng J, Liu YF, Han M. Identification and validation of a new prognostic signature based on cancer-associated fibroblast-driven genes in breast cancer. World J Clin Cases 2024; 12(4): 700-720
- URL: https://www.wjgnet.com/2307-8960/full/v12/i4/700.htm
- DOI: https://dx.doi.org/10.12998/wjcc.v12.i4.700


