Copyright
©The Author(s) 2024.
World J Clin Cases. Feb 6, 2024; 12(4): 700-720
Published online Feb 6, 2024. doi: 10.12998/wjcc.v12.i4.700
Published online Feb 6, 2024. doi: 10.12998/wjcc.v12.i4.700
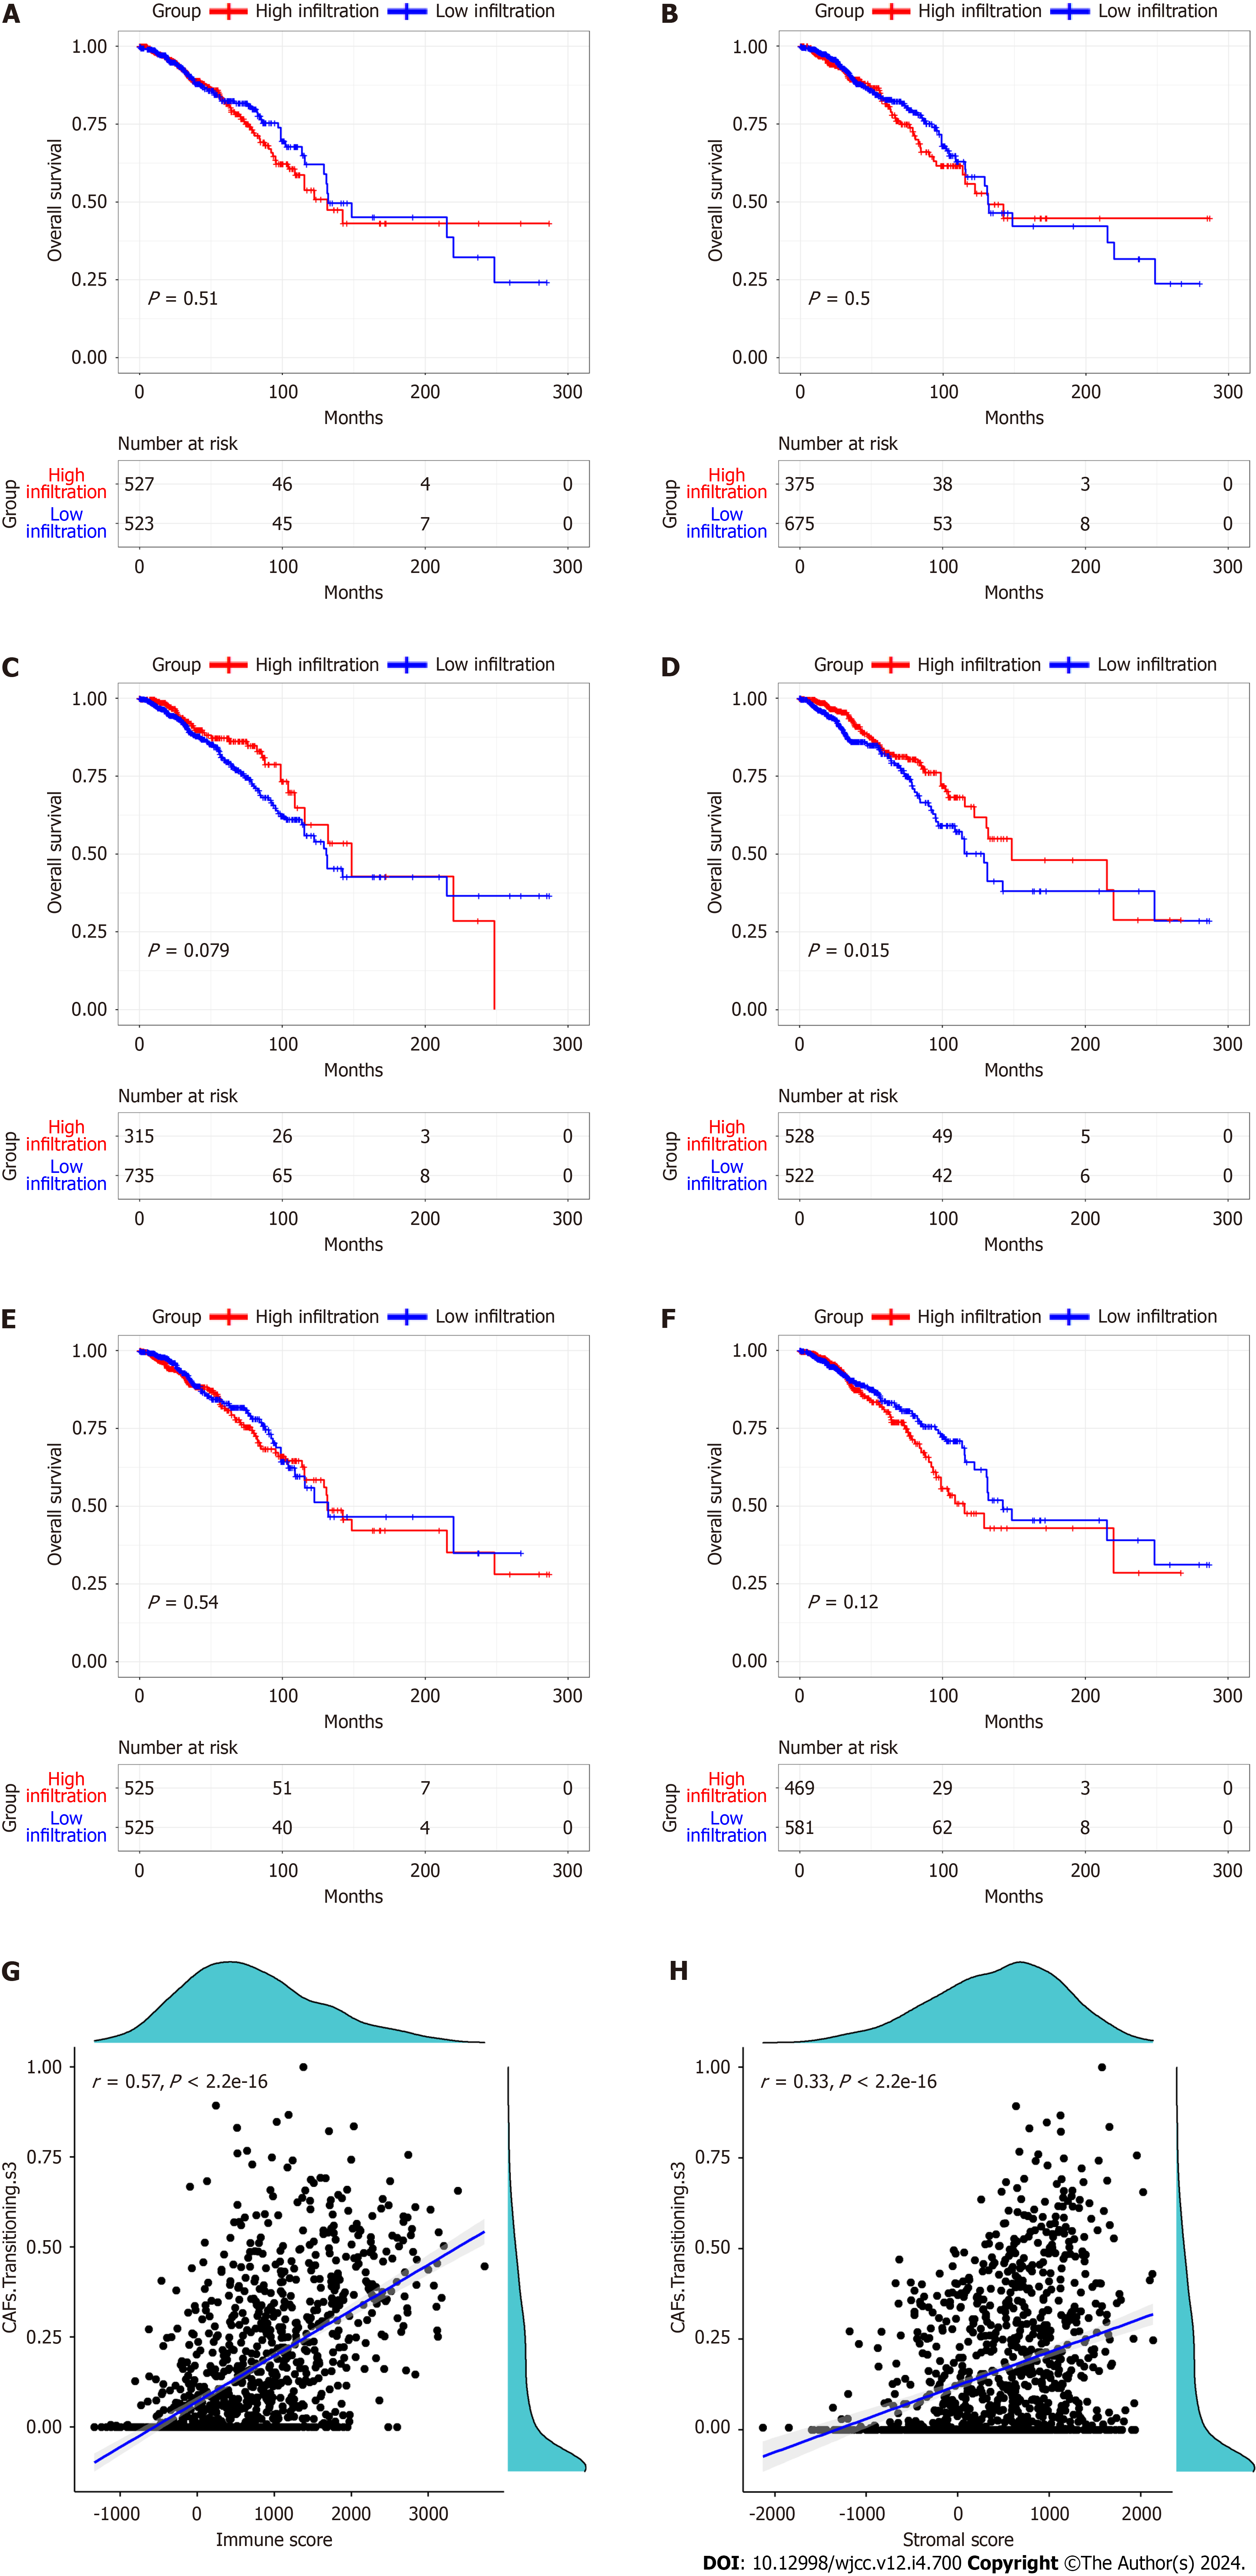
Figure 2 Kaplan-Meier curves of overall survival in relation to cancer associated fibroblasts, and the relationship between the cancer associated fibroblasts transitioning s3 and stromal and immune scores.
A: Cancer associated fibroblasts (CAFs); B: CAFs mesenchymal stem cell (MSC) inflammatory CAF (iCAF)-like s1; C: CAFs MSC iCAF-like s2; D: CAFs Transitioning s3; E: CAFs myCAF like s4; F: CAFs myCAF like s5; G-H: The relationship between the CAFs transitioning s3 and the immune and stromal scores.
- Citation: Wu ZZ, Wei YJ, Li T, Zheng J, Liu YF, Han M. Identification and validation of a new prognostic signature based on cancer-associated fibroblast-driven genes in breast cancer. World J Clin Cases 2024; 12(4): 700-720
- URL: https://www.wjgnet.com/2307-8960/full/v12/i4/700.htm
- DOI: https://dx.doi.org/10.12998/wjcc.v12.i4.700


