Copyright
©The Author(s) 2024.
World J Clin Cases. Dec 6, 2024; 12(34): 6687-6695
Published online Dec 6, 2024. doi: 10.12998/wjcc.v12.i34.6687
Published online Dec 6, 2024. doi: 10.12998/wjcc.v12.i34.6687
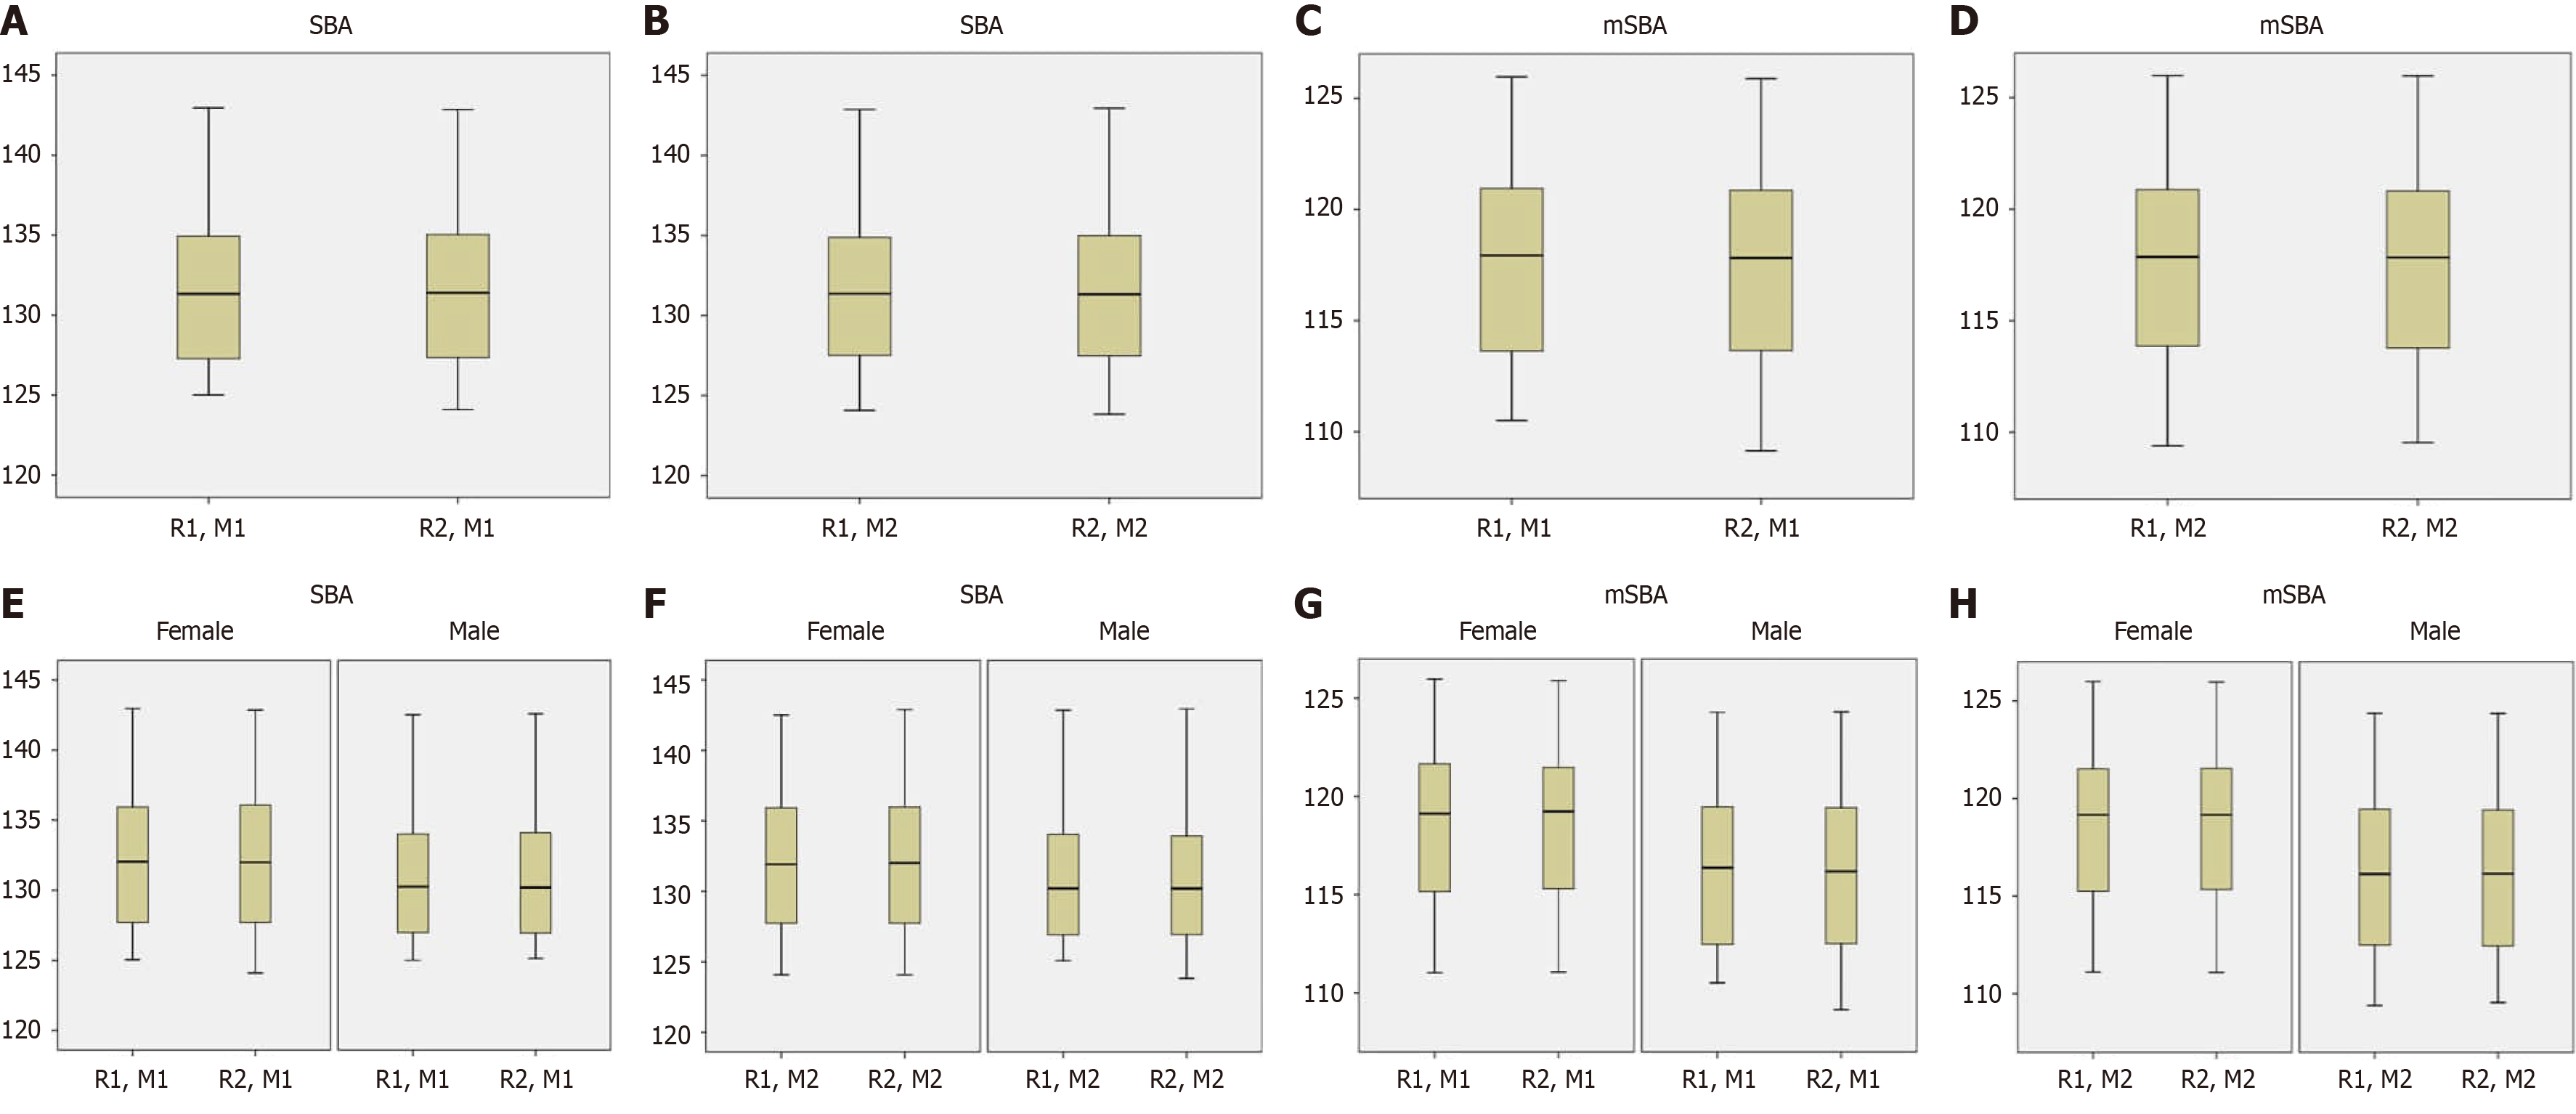
Figure 3 Box-plot analyses showing the data distributions of skull base angle and modified skull base angle.
A, B, E and F: Skull base angle (SBA); C, D, G and H: Modified SBA (mSBA); E, F, G and H: The comparison of data distributions between female and male groups. Similar data distributions were obtained between the reviewers. In addition, lower SBA and mSBA values were observed for the male group in comparison with the females as shown by the box-plots. M1: First measurements; M2: Second measurements; R1: Reviewer 1; R2: Reviewer 2.
- Citation: Kizilgoz V, Aydin S, Aydemir H, Keles P, Kantarci M. Interobserver and intraobserver reliability of skull base angles measured on magnetic resonance images. World J Clin Cases 2024; 12(34): 6687-6695
- URL: https://www.wjgnet.com/2307-8960/full/v12/i34/6687.htm
- DOI: https://dx.doi.org/10.12998/wjcc.v12.i34.6687


