Copyright
©The Author(s) 2024.
World J Clin Cases. Oct 26, 2024; 12(30): 6391-6406
Published online Oct 26, 2024. doi: 10.12998/wjcc.v12.i30.6391
Published online Oct 26, 2024. doi: 10.12998/wjcc.v12.i30.6391
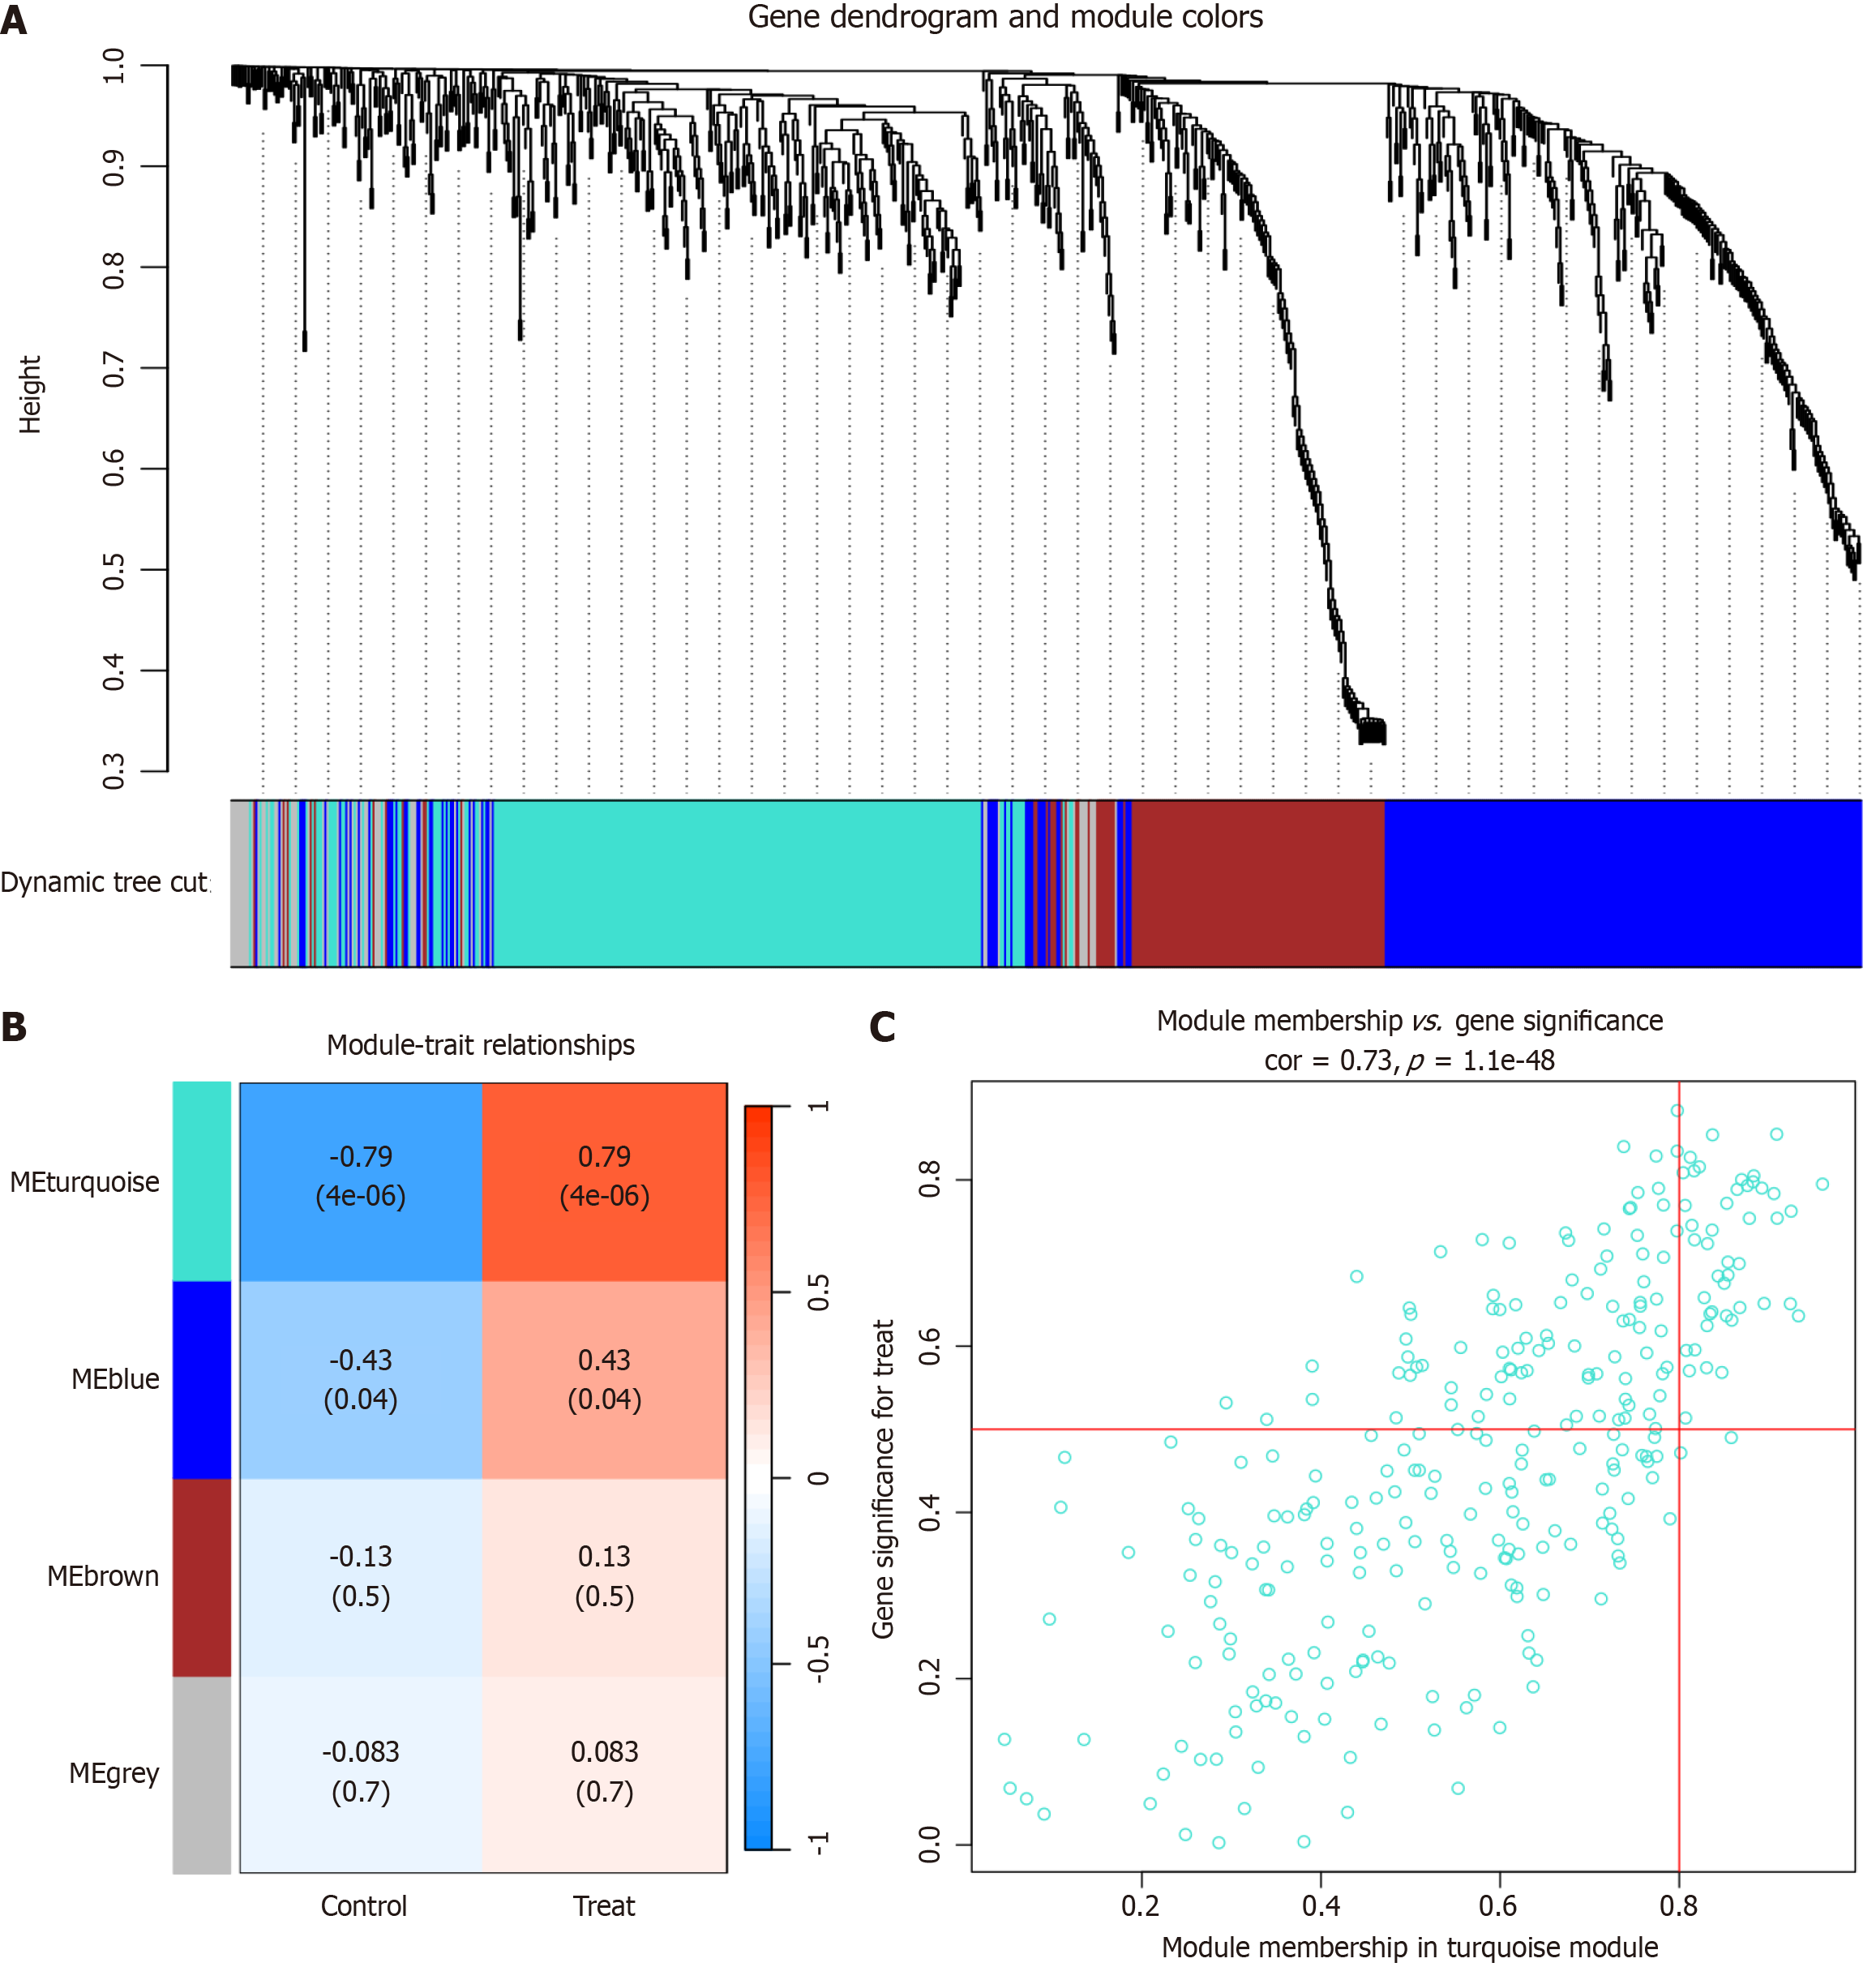
Figure 2 Identification of primary biliary cholangitis-associated gene modules in the Gene Expression Omnibus dataset using weighted gene co-expression network analysis.
A: A dendrogram was generated by clustering genes in the GSE79850 dataset using a topological overlap matrix (1-TOM). Each branch represents a gene, with co-expression modules visualized in different colors; B: A module-trait heatmap displayed the correlation between gene modules and primary biliary cholangitis (PBC) in the GSE79850 dataset. Each module is associated with a correlation coefficient and p-value, indicating the strength and significance of the correlation; C: A scatter plot illustrated the correlation between the turquoise module and PBC in the GSE79850 dataset. The turquoise module exhibits the strongest positive correlation with PBC.
- Citation: Yang YC, Ma X, Zhou C, Xu N, Ding D, Ma ZZ, Zhou L, Cui PY. Functional investigation and two-sample Mendelian randomization study of primary biliary cholangitis hub genes. World J Clin Cases 2024; 12(30): 6391-6406
- URL: https://www.wjgnet.com/2307-8960/full/v12/i30/6391.htm
- DOI: https://dx.doi.org/10.12998/wjcc.v12.i30.6391


