Copyright
©The Author(s) 2024.
World J Clin Cases. Oct 26, 2024; 12(30): 6391-6406
Published online Oct 26, 2024. doi: 10.12998/wjcc.v12.i30.6391
Published online Oct 26, 2024. doi: 10.12998/wjcc.v12.i30.6391
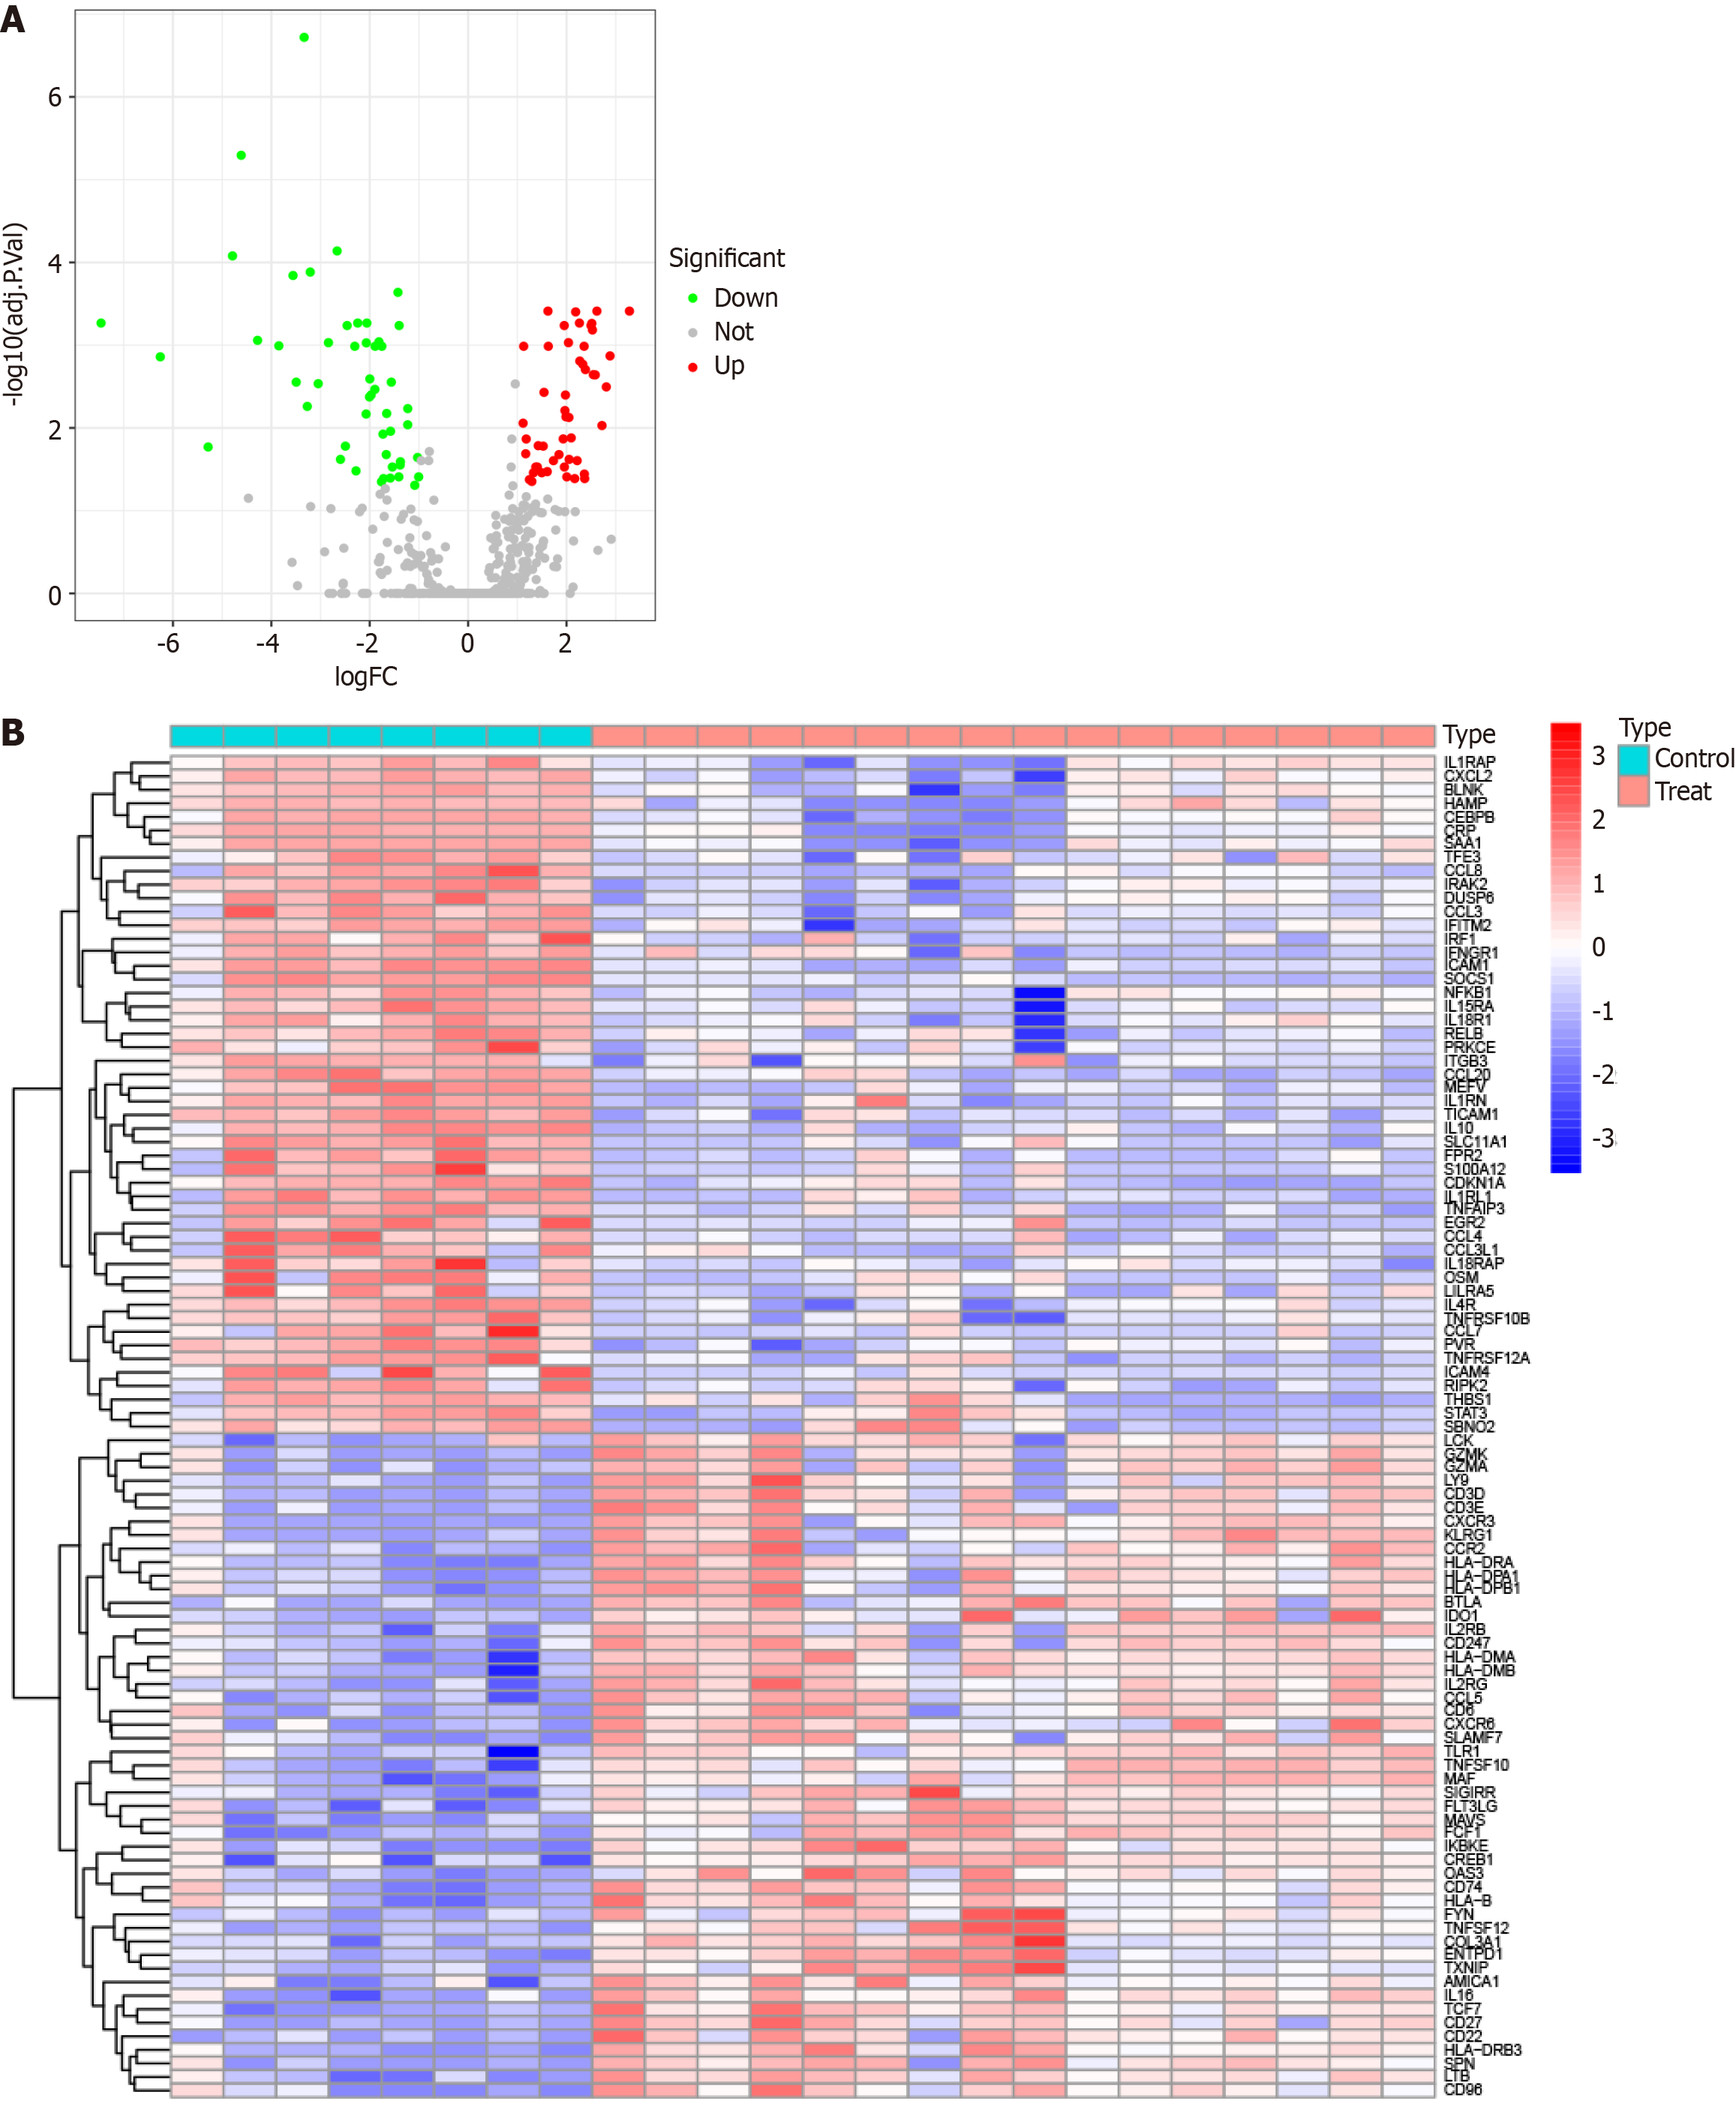
Figure 1 Differentially expressed genes between the primary biliary cholangitis and healthy control groups in the GSE79850 dataset.
A: A volcano plot was generated to visualize the differential expression analysis results. Genes that were significantly upregulated in primary biliary cholangitis are depicted in red, genes that were significantly down-regulated are depicted in green, and genes that did not show significant differential expression are depicted in black; B: A heatmap was constructed to illustrate differential expression patterns for genes in the GSE79850 dataset. PBC: Primary biliary cholangitis; DEGs: Differentially expressed genes; GO: Gene ontology; KEGG: Kyoto encyclopedia of genes and genomes.
- Citation: Yang YC, Ma X, Zhou C, Xu N, Ding D, Ma ZZ, Zhou L, Cui PY. Functional investigation and two-sample Mendelian randomization study of primary biliary cholangitis hub genes. World J Clin Cases 2024; 12(30): 6391-6406
- URL: https://www.wjgnet.com/2307-8960/full/v12/i30/6391.htm
- DOI: https://dx.doi.org/10.12998/wjcc.v12.i30.6391


